
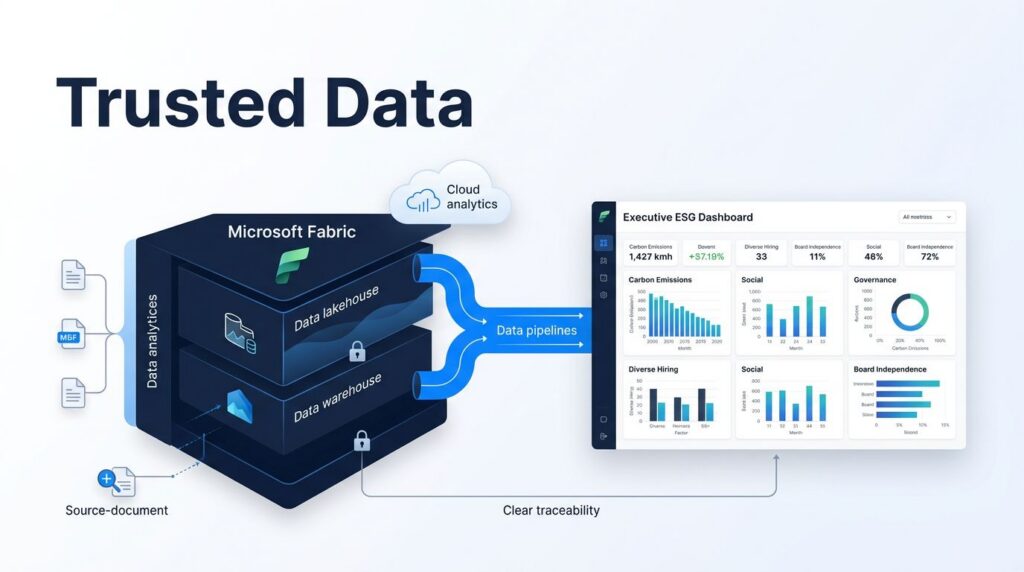
Quarterly environmental social and governance (ESG) disclosure often begins with a scavenger hunt through ERP exports, utility invoices, supplier spreadsheets, and disconnected Power BI reports. An ESG reporting Microsoft Fabric platform brings those records into a governed environment, allowing teams to trace each figure back to its source.
For U.S. companies facing investor requests, customer questionnaires, or overseas sustainability reporting obligations, the goal is clear: reduce manual reconciliation and produce evidence you can defend. Start with reporting decisions, then build the data platform around them.
Key Takeaways
- Begin with clear reporting boundaries, organizational entities, periods, metric owners, and evidence requirements before selecting Fabric tools or building pipelines.
- Use a governed ESG Data Estate with a Lakehouse for detailed source evidence and a Warehouse for curated reporting views that have passed reconciliation and approval.
- Map business keys across SAP, Oracle, suppliers, utilities, and other sources before loading data at scale, while capturing file names, ingestion timestamps, rejection reasons, and lineage.
- Treat ESG metric calculations as tested software delivery by separating source values from reference factors, versioning calculations, and validating custom metrics against approved results.
- Combine data quality, governance, managed Power BI semantic models, capacity planning, and staged implementation to produce ESG reports that are traceable, secure, and defensible under review.
ESG reporting Microsoft Fabric: Begin With Reporting Decisions
A data platform cannot repair unclear reporting boundaries. Before selecting connectors or writing a notebook, agree on the entities, periods, ownership, and calculation rules for each disclosure. The Microsoft ESG data model overview provides an extensible structure for environmental, social, and governance data. It does not determine each organization’s boundaries or reporting choices.
Set a reportable grain for every measure
Carbon, water, waste, workforce, and governance data need a consistent reporting grain. A manufacturing company may report emissions by legal entity, facility, production line, and month. A retailer may also need stores, distribution centers, suppliers, and product categories.
| Reporting decision | Example definition | Fabric design impact |
|---|---|---|
| Organizational boundary | Owned facilities and controlled operations, including relevant joint ventures | Legal entity, facility, and ownership master data |
| Reporting period | Monthly activity with quarterly disclosure periods | Fiscal calendar, cutoff dates, and close-status fields |
| Evidence requirement | Source invoice, meter reading, contract, or supplier attestation | Document ID, source system, file location, and load timestamp |
| Metric ownership | Sustainability, finance, HR, or procurement | Data steward, approval workflow, and review status |
These decisions prevent a common failure: polished dashboards showing different definitions of the same greenhouse gas emissions number.
Put the ESG Data Estate at the Center
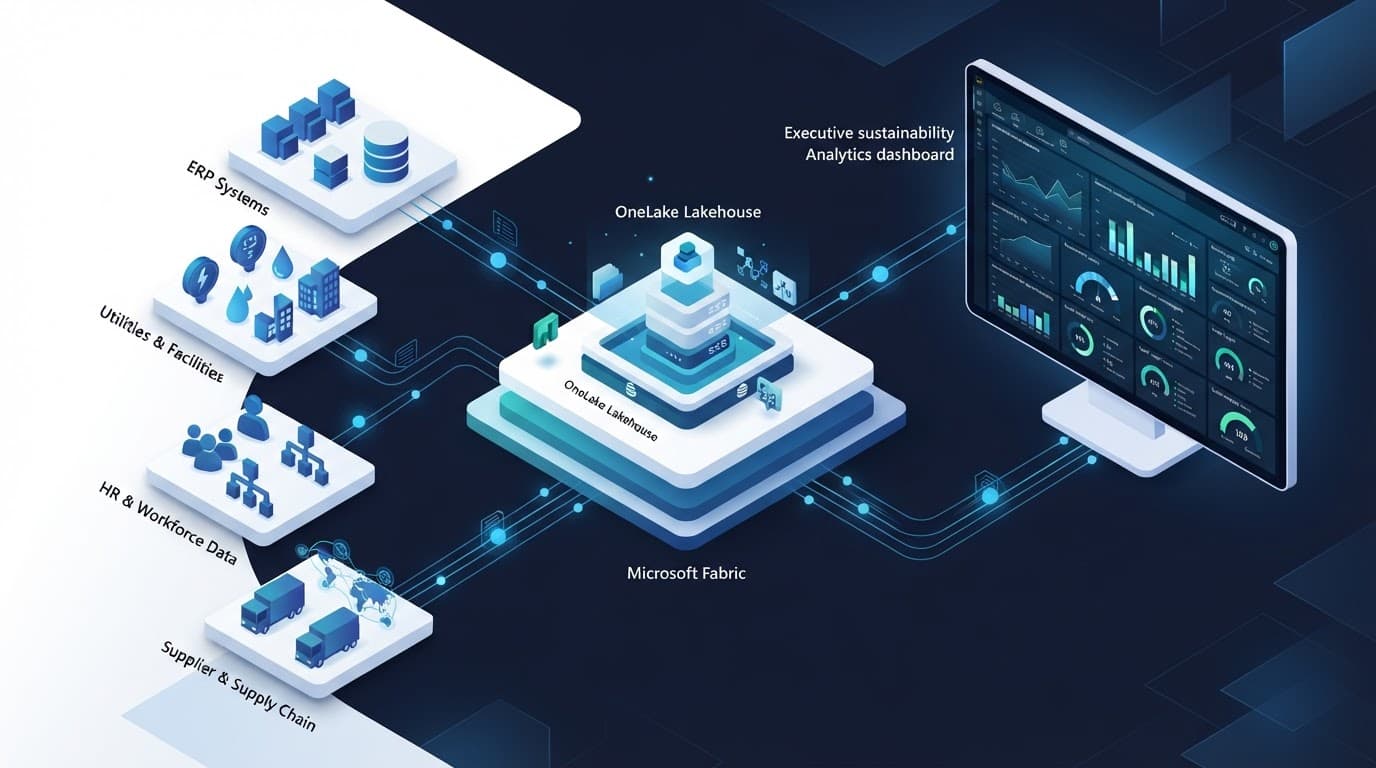
An ESG Data Estate should function as a unified analytics platform for raw evidence, standardized records, reference data, calculations, and reporting outputs. It is not a shared folder for sustainability files, but a controlled data product with data lineage, access rules, and defined owners.
Microsoft Sustainability Data Solutions in Fabric helps ingest, harmonize, and process ESG data from separate sources, as outlined in its Fabric sustainability release plan. This matters when finance, procurement, operations, and HR each own part of the reporting record.
Use a Lakehouse for detailed evidence
A Microsoft Fabric Lakehouse is a strong home for invoices, meter readings, supplier files, ERP extracts, audit evidence, and transformed ESG model tables. This lakehouse architecture separates raw evidence from processed tables. Raw records preserve what arrived, while processed tables apply common units, facility mappings, reporting periods, and quality rules.
Shortcuts can help when operational data already resides in Azure Data Lake Storage, Amazon S3-compatible systems, or other domains. They reduce unnecessary copies while keeping governed access close to the analytics workload.
Use a Warehouse for controlled reporting views
A Microsoft Fabric Warehouse fits curated SQL tables that finance, audit, and BI teams need for repeatable queries. It should not replace detailed Lakehouse storage. Instead, it should expose governed reporting views that have passed reconciliation and approval.
Ingest SAP, Oracle, and Supplier Data Without Rebuilding Manual Work
Most ESG projects fail at the source mapping stage, not in the dashboard. SAP may store energy consumption and costs, plus production volumes, under different cost objects. Oracle might hold supplier, legal-entity, or purchasing data that does not match sustainability reporting boundaries. Utility providers, travel platforms, and waste vendors add more formats.
Map business keys before loading volume
Start with a source inventory and identify the keys that connect each record to a reporting entity. Reconcile supplier IDs, facility codes, legal entities, cost centers, units of measure, currencies, and fiscal calendars before loading volume or building recurring loads.
Fabric Data Factory consulting helps teams design data pipelines that record source file names, ingestion timestamps, and rejection reasons. Those details matter when a sustainability controller asks why an emission figure changed after a late supplier file arrived.
Choose low-code tools for repeatable transformations
A Dataflows Gen2 implementation works well for visible, rules-based transformations that analysts need to review. Fabric’s Dataflow Gen2 overview explains its role in multi-step ingestion and transformation flows. Use notebooks or SQL for complex joins, high-volume processing, and reusable validation logic.
Strong Microsoft Fabric data engineering services set clear boundaries between low-code flows and engineered pipelines. For example, use a dataflow to standardize a utility export, then use a pipeline and notebook to connect it to facility, calendar, and emission-factor tables.
Compute ESG Metrics With Tested Pipelines
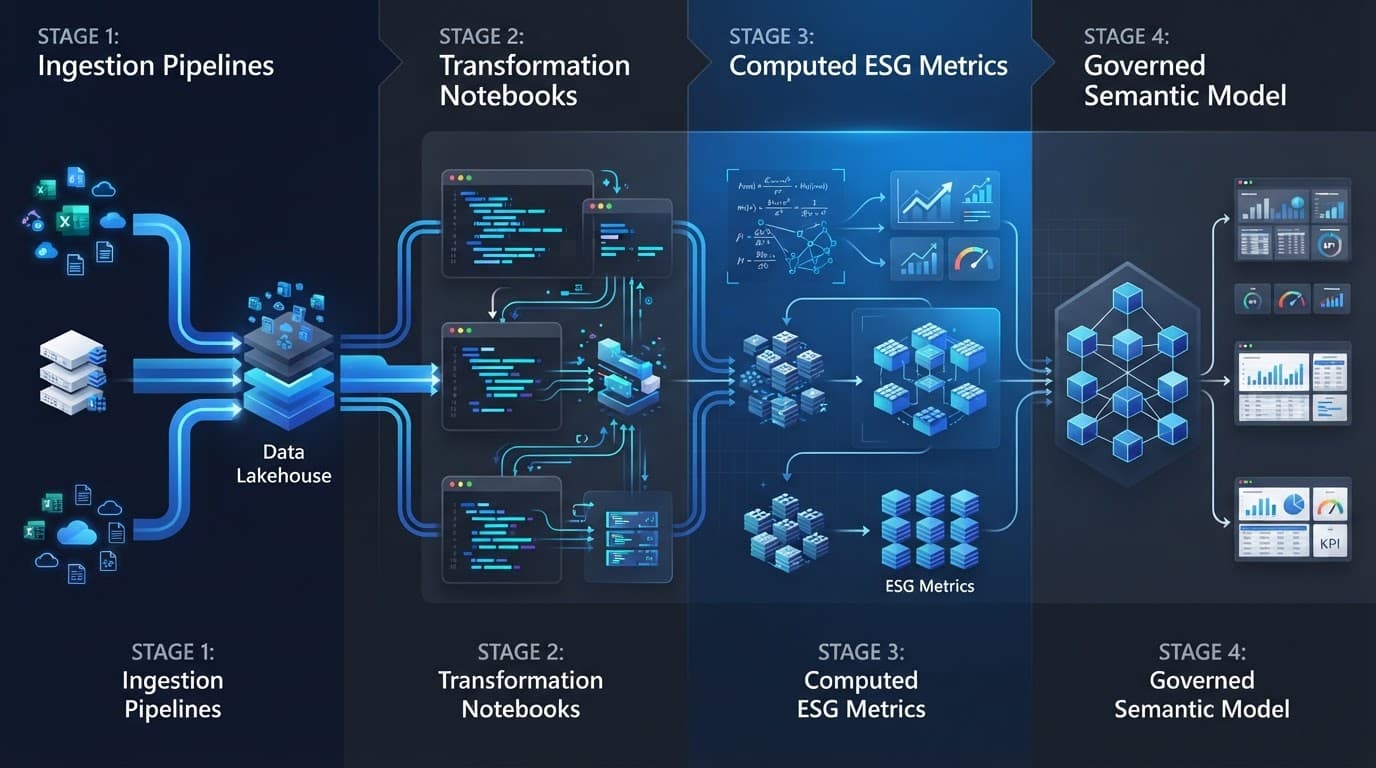
A sound Fabric-based ESG reporting design treats metric calculation as software delivery. Raw activity data is only the beginning. Teams must convert it into processed ESG data, apply approved reference factors, and produce computed ESG metrics. Store the source, factor, calculation version, and full audit trail together.
Separate source values from reference data
Store consumption, distance, production, spend, and headcount separately from emission factors, conversion rules, labels, and calculation versions. A factor update should trigger a controlled recalculation, not overwrite the historical input.
Microsoft’s documented ESG metrics workflow uses prebuilt notebooks and pipelines. It loads metric definitions into MetricsDefinitions and MetricsLabels tables, then computes output from processed ESG data. Deployment item names and preview features can change, so validate current Microsoft release guidance before automating production runs.
Test custom metrics as carefully as prebuilt ones
Prebuilt metrics can speed up work for common disclosure needs aligned with CSRD reporting standards. However, a company may need additional logic for leased assets, manufacturing yield, renewable-energy certificates, supplier-specific factors, or internal targets.
Build test cases for every custom metric. Compare a sample calculation with an approved finance or sustainability workbook, then record the expected result. Include error handling for missing factors, invalid units, duplicate records, and late corrections.
A disclosed value needs a source record, a calculation version, and a named owner. Without all three, a dashboard number remains difficult to defend.
Bring Scope 3 Data Into an Auditable Process
In carbon accounting, “Scope 3 emissions” are usually the least complete part because suppliers control much of the underlying data. Fabric supports carbon emissions tracking by centralizing procurement spend, purchase orders, logistics activity, supplier declarations, and product-level carbon data, but it can’t turn an estimate into primary evidence.
Microsoft Sustainability Data Solutions in Fabric can connect directly to Microsoft Sustainability Manager for carbon, water, and waste data. Sustainability Manager is useful, but it isn’t required. Companies can also build their ESG data estate around other operational and third-party sources. Microsoft’s sustainability learning path outlines the broader Microsoft for Sustainability components.
Track data quality beside the emissions value
Each Scope 3 record should show whether it uses supplier-provided activity data, spend-based estimates, industry factors, or modeled data. Add fields for coverage, reporting period, source reliability, factor version, and approval status.
These quality fields provide supply chain analytics that help procurement and sustainability teams prioritize supplier engagement where it can reduce uncertainty. They also stop estimated and verified values from appearing identical in executive reporting.
Apply Microsoft Fabric Governance Before Analysts Build Reports
Data governance works best when it enters the architecture at ingestion. Classification, access policy, lineage, quality thresholds, retention, and stewardship must apply to the data product itself, not only to its final report.
AP Pension offers a useful pattern for regulated organizations. Its data platform team anonymized personal data as it entered Fabric, which allowed domain specialists to analyze approved data without handling unnecessary personally identifiable information. Healthcare, financial services, education, and workforce reporting teams can apply the same principle.
Protect records at the right level
Microsoft Fabric governance should define workspace roles, data owners, sensitivity labels, and access paths for each ESG domain. Limit detailed employee, supplier, or financial information to authorized users. Then publish aggregated semantic models with approved measures for broad business consumption.
Microsoft Purview Compliance Manager can also import disclosure metrics from a Fabric ESG data estate through Microsoft’s Sustainability Data Solution connector. Document the assessment owner, evidence-retention rule, and daily import timing for Microsoft Purview Compliance Manager before assigning compliance responsibilities. The connector’s documented daily import schedule means teams should not treat it as a real-time compliance control. Review timing, evidence retention, and assessment ownership before relying on it for regulatory compliance.
Make Power BI Reports Depend on Managed Semantic Models
Power BI dashboards should consume approved business logic, not recreate calculations in every report. Strong Microsoft Fabric Power BI integration connects each report to governed Fabric semantic models that define emissions, water intensity, waste diversion, supplier coverage, and reporting periods once.

Design models for reporting change
Create separate semantic models for detailed operational analysis and executive disclosure reporting when access or refresh needs differ. Use certified measures, role-based security, and clear display labels. Finance users shouldn’t have to guess whether “emissions” means gross, net, location-based, market-based, or estimated.
Power BI semantic model optimization also reduces costly refresh failures. Remove unused columns, control high-cardinality fields, and use incremental refresh where appropriate. Keep calculation logic close to the curated data layer. Fabric semantic models should remain small enough to refresh predictably during busy reporting periods.
Plan Capacity Before Reporting Deadlines
ESG reporting combines scheduled ingestion, notebooks, SQL workloads, semantic model refreshes, and Power BI usage. A capacity that seems sufficient during a pilot may struggle during quarter-end runs, especially when multiple business units share an environment.
Microsoft Fabric capacity planning starts with workload measurements, refresh windows, storage growth, concurrent users, and critical reporting deadlines. Separate experimental development from production reporting when the workload justifies it. Monitor failed activities, long-running queries, throttling, and refresh duration.
Microsoft Fabric performance optimization should begin with data design before adding capacity. Partition large tables, avoid repeated transformations, schedule noncritical processing outside reporting windows, and remove redundant models. After go-live, Microsoft Fabric managed services can monitor operations, support incident response, manage release controls, and conduct regular cost reviews. Optimize Fabric Performance and Cost when current workloads consume capacity without producing faster insight.
Deliver the Platform in Controlled Stages
A staged Fabric implementation for ESG reporting reduces risk because each release proves data quality before the next domain arrives. It also gives executives usable reporting early, rather than waiting for every source system to be perfect.
Begin with a difficult but bounded use case
Pick one reporting outcome with meaningful business value, such as facility energy and Scope 1 and 2 emissions, supplier-spend coverage, or workforce disclosures. Include at least one difficult source system and one formal reconciliation requirement. That exposes integration and ownership gaps early.
A practical rollout often follows four stages:
- Define the reporting contract, owners, data sources, evidence needs, and initial metrics.
- Build ingestion, quality checks, a Lakehouse data model, and a governed set of semantic models.
- Reconcile results with existing reports, resolve exceptions, and document calculation logic.
- Add Scope 3, social, governance, and real-time operational sources after the foundation proves reliable.
For companies that need to migrate to Microsoft Fabric, this approach supports broader data platform modernization without a disruptive replacement program. A Microsoft Fabric migration may include legacy ETL jobs, Azure services, spreadsheets, and fragmented reporting. A Power BI to Microsoft Fabric migration should also review workspace structure, dataset ownership, refresh schedules, security, and capacity, not merely move reports. That is analytics modernization with a measurable operating purpose.
Microsoft’s current deprecation guidance is also worth reviewing, because older deployment paths and supporting components can change.
Short Success Story: ESG Reporting With Microsoft Fabric
Spargent partnered with a global stainless steel producer. The goal was clear: deliver results. The team built a modern ESG reporting platform using Microsoft Fabric.
Manual ESG reporting dropped by 40–60%. Audit preparation became much faster. Compliance with CSRD was easier. The platform automated environmental disclosures. It unified environmental, operational, and financial data. Accuracy improved immediately. The system can be adapted for any sector. Companies in manufacturing, energy, and consumer goods now simplify ESG reporting. They gain efficiency and save costs.
The project took just three months. Spargent still provides engineering support. The team is building new integrations. Legacy and ERP systems connect smoothly. Data is consolidated across the enterprise. Disruption is minimal. Ongoing value is maximized.
Key deliverables were clear. Automated data pipelines. Lakehouse architecture. Standardized ESG data models. Power BI reporting. Strong governance and monitoring. Continuous optimization. All these drove real efficiency gains.
U.S.-Ready Fabric Delivery With Senior European Specialists
Spargent Analytics is a Microsoft Fabric implementation partner for U.S. mid-market and enterprise organizations that need experienced delivery without building a large internal data team. Built around the needs of U.S. companies. Delivered by senior Microsoft Fabric specialists from Europe.
This EU-to-USA delivery model combines senior engineering depth, an efficient cost structure, direct communication, and overlap with U.S. working hours. It gives clients better ROI than traditional U.S.-only consulting models while keeping product decisions close to business owners.
Support across the full Fabric lifecycle
Spargent’s Microsoft Fabric consulting services cover strategy, architecture, implementation, migration, data governance, optimization, training, and managed support. Governance engagements can include Microsoft Purview Compliance Manager configuration, assessment ownership, and evidence workflows. Microsoft Fabric consultants work alongside internal analytics teams or operate as the delivery team where no dedicated data function exists.
Engagements can include OneLake consulting, Lakehouse and Warehouse design, Fabric Data Factory consulting, Dataflows Gen2, pipelines, Fabric Real-Time Intelligence, Power BI modernization, semantic models, capacity reviews, and governed reporting. A Microsoft Fabric expert can also support Microsoft Fabric analytics consulting, data engineering consulting USA engagements, and Microsoft Fabric consulting USA programs that need senior technical ownership.
Book a Microsoft Fabric Discovery Call to review ESG sources, Power BI reporting gaps, Fabric capacity, and the fastest path to a governed reporting foundation.
Frequently Asked Questions
What is ESG reporting Microsoft Fabric?
ESG reporting Microsoft Fabric is a governed data platform approach that brings environmental, social, and governance records into one analytics environment. It connects source evidence, calculations, semantic models, and Power BI reporting so teams can trace disclosed values back to their origins.
Should ESG data be stored in a Fabric Lakehouse or Warehouse?
A Lakehouse is well suited to detailed evidence such as invoices, meter readings, supplier files, ERP extracts, and transformed ESG tables. A Warehouse can then expose curated SQL views for finance, audit, and BI teams without replacing the detailed Lakehouse storage.
Can Microsoft Fabric integrate SAP, Oracle, and supplier data for ESG reporting?
Yes, Fabric can ingest data from SAP, Oracle, supplier systems, utilities, travel platforms, and waste vendors. Successful implementations first reconcile business keys such as facility codes, legal entities, supplier IDs, units, currencies, and fiscal calendars.
How does Fabric support auditable Scope 3 emissions reporting?
Fabric can centralize procurement spend, logistics activity, supplier declarations, and product-level carbon data while recording the quality and source of each value. Teams should distinguish supplier-provided activity data from estimates and modeled data because the platform cannot turn an estimate into primary evidence.
How should Power BI be used in a Fabric ESG platform?
Power BI reports should consume governed Fabric semantic models with certified measures, role-based security, and consistent definitions for metrics such as gross, net, location-based, and market-based emissions. Keeping calculation logic in the curated data layer helps prevent different reports from recreating the same metric inconsistently.
Build Reporting That Holds Up Under Review
A strong ESG platform does more than display carbon totals. It connects source evidence, approved calculation logic, governed access, and business reporting within one operating model.
With ESG reporting Microsoft Fabric, sustainability teams can replace scattered Excel workflows with traceable data for finance, operations, procurement, and auditors. Reporting becomes faster, while leadership gains a more reliable view of operational progress.
