
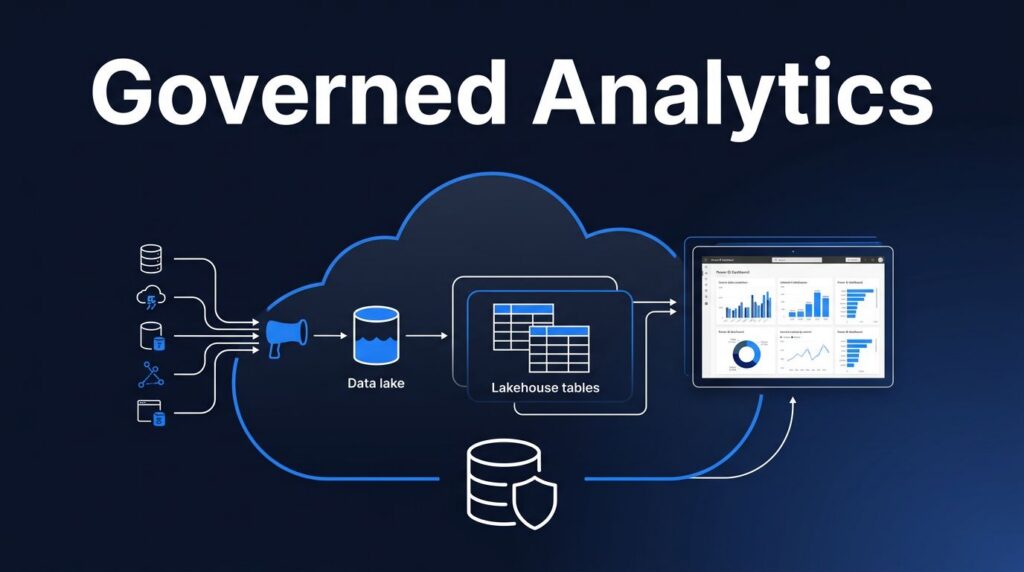
A report can look polished while the underlying data is outdated, duplicated, or missing key fields. That is why implementing a reliable Microsoft Fabric data quality scorecard matters for your organization. By standardizing these measurements, you establish the foundation for robust data governance that ensures your reporting remains accurate and dependable.
In Microsoft Fabric, the hard part is not drawing the dashboard. It is deciding what to measure, where to test it, and how to connect technical failures to business risk. Once you get that right, teams stop debating the numbers and start trusting them.
Key Takeaways
- A useful scorecard tracks business-facing quality signals, not just technical metrics like null counts or failed load attempts.
- In Microsoft Fabric, effective quality checks span pipelines, lakehouse tables, governance tools like Microsoft Purview, and Power BI reporting.
- Modern architectures require tracking data quality across various data products to ensure consistent health metrics for different business domains.
- Real-time alerts are essential when data freshness directly impacts daily operations, safety, revenue, or customer service.
- U.S. companies often accelerate their implementation by working with a specialist Microsoft Fabric partner to handle design, migration, optimization, and ongoing support.
Start with the quality metrics that matter
A Fabric data quality scorecard should show whether data is fit for use, rather than whether a single pipeline succeeded at 2:00 AM. To achieve this, you need to establish data quality metrics that business owners understand and that engineers can trace back to source systems.
In practice, most teams start with the six dimensions used by Microsoft Purview, which utilizes robust data profiling to assess completeness, consistency, conformity, accuracy, freshness, and uniqueness. These categories work well because they cover both technical defects and operational risk.
This is the simplest way to frame the scorecard:
| Dimension | What to measure | Why the business cares |
|---|---|---|
| Completeness | Null rates, missing records | Missing revenue, claims, or patient events |
| Uniqueness | Duplicate keys, duplicate transactions | Double counting and broken joins |
| Freshness | Load delay, stale partitions | Late decisions and missed SLAs |
| Consistency | Mismatched values across systems | Conflicting reports across teams |
| Conformity | Invalid formats, bad codes | Failed downstream logic |
| Accuracy | Rules tied to known business truth | Wrong decisions from bad data |
The scorecard should roll up these checks by domain, dataset, and executive priority. A sales mart may care most about freshness and uniqueness. A healthcare dataset may weight completeness and conformity more heavily. A finance team may treat accuracy breaches as critical, even if only a small number of rows fail.
Fabric helps because OneLake provides a shared storage layer across workloads, creating a Unified Catalog where these metrics reside. Still, the scorecard must map to real assets such as a Microsoft Fabric Lakehouse, a Microsoft Fabric Warehouse, and the semantic layer that business users see in Power BI. If your team is doing OneLake consulting or restructuring domain ownership, define those relationships early.
For governance-heavy environments, this scorecard becomes a foundational element of Microsoft Fabric governance. By integrating these checks into your broader data governance strategy, the system can clearly tell data stewards what failed, where it failed, and who owns the fix. If you want to see that governance workflow in action, this Microsoft Purview Data Quality walkthrough is a useful reference.
Build validation into Fabric, not after it
The scorecard should sit on top of real tests. If the only place you measure quality is the final dashboard, you are already too late.
That is a common gap in Fabric projects. Fabric has strong building blocks, but it does not yet give every team a full, native rule framework across all transformation workloads. As a result, strong implementations combine Fabric services with Purview and targeted testing tools.
A practical pattern looks like this. Ingestion starts with data engineering pipelines, mirrored data, or shortcuts. Then the first checks happen close to the source, usually in Fabric Data Factory consulting engagements, notebook-based validations, or Dataflows Gen2 implementation work. These checks catch schema drift, required-column failures, broken date values, and row-count anomalies before bad data moves downstream.
Next, the model layer should quarantine bad rows instead of hiding them. Some teams use Great Expectations in Fabric notebooks to validate data as it transitions through the medallion architecture. Others use dbt tests in the transformation layer to ensure consistency within the Delta format. For advanced observability, Soda or Monte Carlo can catch drift that fixed rules miss.
Materialized lake views add another option. Fabric supports constraints on these materialized lake views, and Microsoft documents each data quality report for sharing those results. That is useful when you want engineers and business owners looking at the same status.
Purview then becomes the scoring and governance layer. It profiles tables, stores rule outcomes, and rolls scores up across data assets and data products. As of 2026, Purview added broader custom SQL rules and error record publishing, which makes failed rows easier to inspect and route for correction.
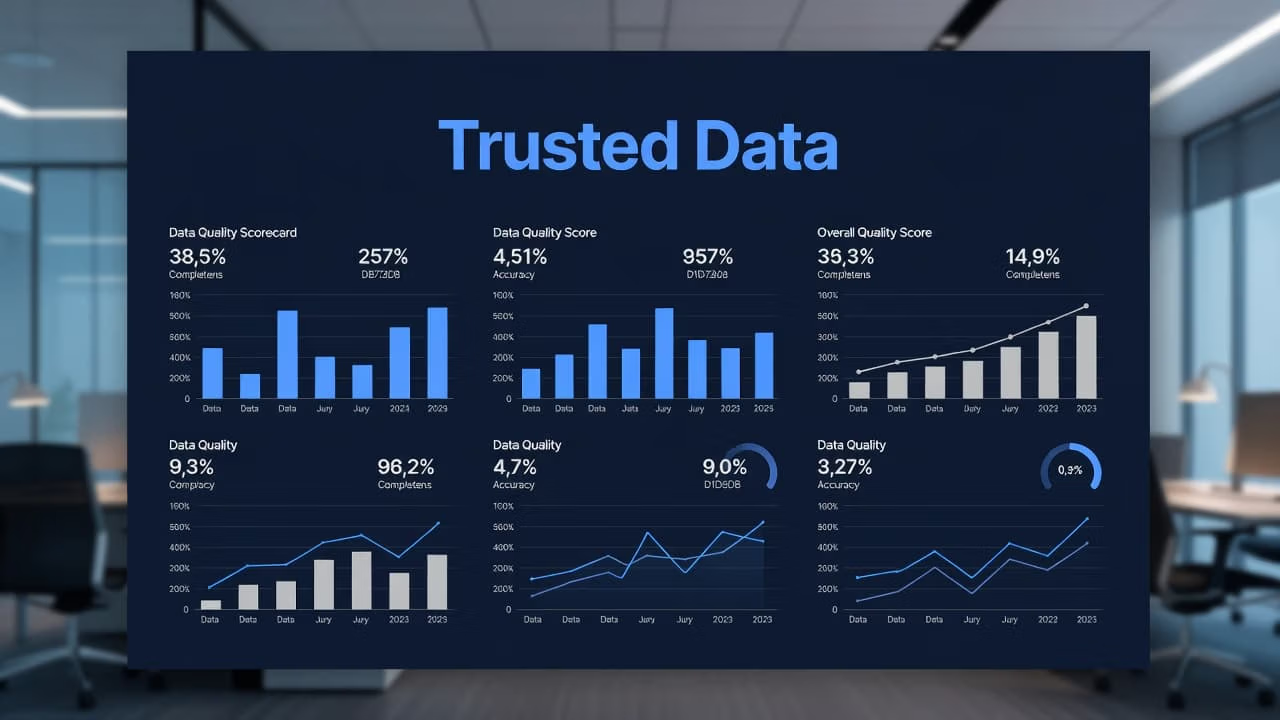
The last step is presentation. This is where Microsoft Fabric Power BI integration matters. Build the scorecard in Power BI, connect it to curated quality tables, and expose it through a unified semantic model. If you skip the semantic model, leaders will struggle to interpret the metrics. If you skip tuning, the scorecard itself becomes slow, which is why Power BI semantic model optimization belongs in the same project.
A good overview of this engineering-first approach appears in Endjin’s piece on building data quality into Microsoft Fabric.
Turn the score into an executive dashboard
A scorecard becomes useful when it answers three questions fast: what failed, how bad it is, and whether anyone needs to act today.
The dashboard should not dump hundreds of rule results onto one page. Instead, create an executive page with a weighted quality index, domain scores, freshness status, and open incidents. Then add drill-through pages for stewards and engineers. Those deeper views should show failed rules, affected tables, recent trend lines, and sample bad records delivered via clear Power BI reports.
If your quality review happens once a month, the scorecard has already missed the moment that mattered.
This is where Fabric Real-Time Intelligence can add real value. By leveraging native anomaly detection, teams can pinpoint irregularities the moment they occur rather than waiting for scheduled batches. For example, Microsoft has published customer cases where Fabric real-time analytics gave front-line teams live fleet visibility, helped Petrobras react faster to cyber risk, and cut defect identification from hours to less than a minute when paired with Azure AI. You can further enhance these checks by using AI functions to identify complex patterns in your data health. Those are not vanity stories. They show why freshness and proactive monitoring belong on the scorecard.
Near real-time scoring also matters for retail and operations. Microsoft has described how retailers use OneLake, Power BI, and event-driven analytics to react to inventory and demand changes with far less lag. Iceland Foods adopted Fabric to replace slower reporting cycles and move closer to live operational insight. If stale data hurts staffing, pricing, or fulfillment, your scorecard should surface that within minutes. You can even use Data Activator to trigger immediate alerts based on these scorecards, ensuring that the right stakeholders are notified before a minor inconsistency becomes a major business problem.
For reporting, Direct Lake can help reduce latency between curated data and the Power BI view. Meanwhile, the semantic layer should map technical metrics to business language such as “late shipments affected” or “orders excluded from margin reporting.”
When to bring in a Microsoft Fabric partner
Many U.S. companies know they need cleaner data, better reporting, and less Excel patchwork. Fewer have the in-house capacity to build a scorecard that spans ingestion, validation, governance, semantic modeling, real-time alerting, and executive reporting.
That is where Spargent Analytics fits. Spargent provides Microsoft Fabric consulting services for U.S. mid-market and enterprise teams that need support, or do not have internal analytics teams at all. Its Microsoft Fabric consultants work across the full data lifecycle, including Microsoft Fabric data engineering services, Lakehouse and Warehouse design, Power BI reporting, governance, and ongoing support.
Built around the needs of U.S. companies. Delivered by senior Microsoft Fabric specialists from Europe.
That model gives clients U.S. market ready delivery with senior European engineers, strong communication, and a more efficient cost structure than many USA only firms. For buyers focused on ROI, that often means faster delivery without staffing up a full internal team.
Spargent can act as a Microsoft Fabric implementation partner when a company needs end-to-end build ownership, or as the extra Microsoft Fabric expert capacity inside an existing team. The scope often includes Fabric Data Factory consulting, Dataflows Gen2 implementation, Microsoft Fabric Lakehouse architecture, Microsoft Fabric Warehouse modeling, OneLake consulting, Fabric semantic models, and Microsoft Fabric analytics consulting for leadership reporting. We emphasize contextual data quality to ensure metrics align with your specific business goals, utilizing metadata management to keep your governance frameworks organized as your environment scales.
Migration work is another common trigger. Whether you are planning a Microsoft Fabric migration, trying to migrate to Microsoft Fabric from older ETL stacks, or tackling a Power BI to Microsoft Fabric migration, a quality scorecard helps protect trust during the move. By establishing data contracts, we ensure consistency between source systems and your new destination. It shows where logic changed, where refresh patterns improved, and where data still needs remediation.
After go-live, the focus usually shifts to Microsoft Fabric performance optimization, Microsoft Fabric capacity planning, Microsoft Fabric governance, and Microsoft Fabric managed services. We often use a service principal to securely automate your data quality scan tasks, ensuring your validation logic runs reliably without manual intervention. Because we operate at the enterprise level, we also help you integrate Microsoft Purview to maintain full visibility across your data estate. Those areas matter because a slow semantic model or poorly sized capacity can damage confidence as much as bad source data. If that is your bottleneck, Optimize Fabric Performance and Cost is a practical next step.
For U.S. teams comparing data engineering consulting USA firms or looking for Microsoft Fabric consulting USA support, Spargent’s model is simple: enterprise grade Microsoft Fabric solutions for U.S. companies, delivered by senior consultants from Europe. If your larger goal is data platform modernization or analytics modernization, a discovery session can shorten the path. You can Book a Microsoft Fabric Discovery Call to review your current architecture, reporting pain points, and next best move.
Frequently Asked Questions
How do I decide which data quality metrics are most important for my organization?
Start by focusing on business impact rather than just technical metadata. Map your metrics—such as freshness, accuracy, and completeness—to specific business processes so that stakeholders understand why a score is low and how it affects their daily operations.
Can I automate data quality testing within the Microsoft Fabric ecosystem?
Yes, you can build validation into your workflows by using Fabric notebooks for custom checks, Dataflows Gen2 for early ingestion testing, and Microsoft Purview to centralize rule outcomes. This approach ensures that you catch errors during the transformation process rather than only identifying them after they reach your reporting dashboards.
What is the advantage of using a dedicated Microsoft Fabric partner for data quality?
A partner provides the specialized experience needed to architect complex governance frameworks, manage performance optimization, and implement automated alerting. They help accelerate your implementation by applying proven patterns for data profiling, semantic model tuning, and cross-domain validation that are difficult to build in-house.
How does a data quality scorecard improve executive decision-making?
A well-designed scorecard removes the ambiguity surrounding data reliability, allowing leadership to act with confidence. By surfacing domain-specific quality scores and real-time alerts, executives can immediately distinguish between a minor data delay and a critical issue that requires urgent intervention.
Build trust before you build another dashboard
A good Fabric data quality scorecard is not a cosmetic report. It is a working system that ties rules, ownership, governance, and business impact together. To be truly effective, the scorecard should be organized by governance domain, ensuring that data stewardship aligns with the specific areas of the business that depend on it most.
When quality checks live inside pipelines, scores roll up through governed assets, and Power BI shows the right level of detail, teams trust the numbers more quickly. By performing a consistent data quality scan, your organization can identify issues before they impact decision-making, which is essential for building long-term confidence in your reporting. Ultimately, that trust is what cuts reporting delays, reduces spreadsheet workarounds, and improves ROI from your Fabric data quality scorecard.
