
In This Article
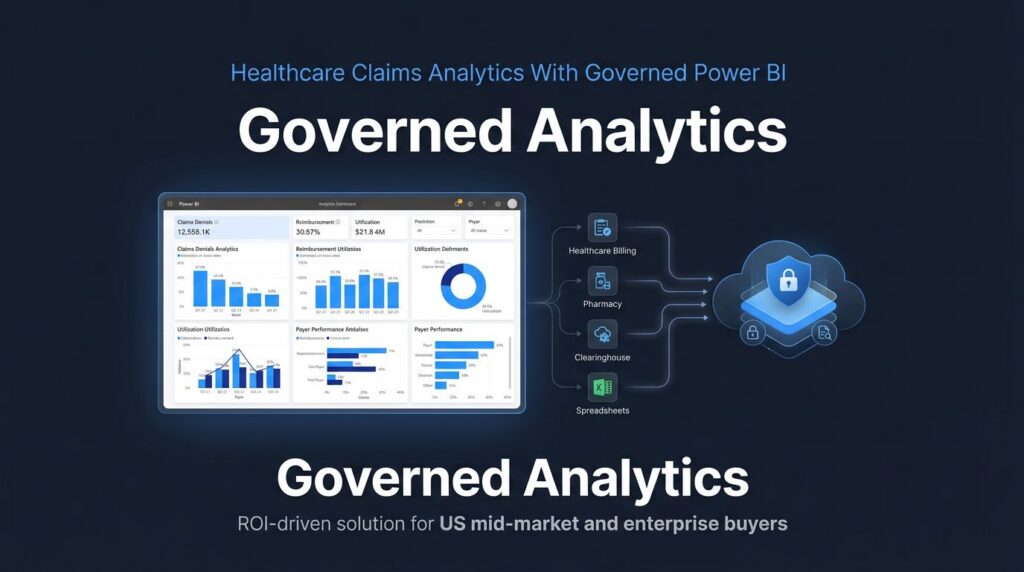
Claims reports can look complete while hiding why cash gets stuck in accounts receivable. Healthcare claims analytics gives finance, revenue cycle, and operations teams one governed view of denials, reimbursement, utilization, and payer performance.
When records span billing systems, clearinghouses, pharmacy feeds, and spreadsheets, teams spend too much time reconciling numbers. A well-designed Fabric and Power BI environment replaces that work with traceable data, shared definitions, and reports that support action. Claims data analysis starts with the available records and the business questions they must answer.
Key Takeaways
- Healthcare claims analytics gives finance, revenue cycle, and operations teams a governed view of denials, reimbursement, utilization, and payer performance.
- Reliable claims data analysis depends on clear scope, source tracking, refresh dates, population rules, vocabulary mapping, and separate medical, pharmacy, open, and closed claims structures.
- Microsoft Fabric supports a traceable claims platform through raw, curated, and analytical layers, while Power BI semantic models turn governed data into actionable reporting.
- Reducing denials requires diagnostic and predictive analysis that connects payer, facility, provider, procedure, and reason patterns to owners and next actions.
- Privacy controls, certified measures, row-level security, and capacity planning are essential for trusted and sustainable healthcare reporting.
Start with claims data that can answer business questions
Claims data is an administrative record of services, costs, and adjudication. It can describe much of a patient’s journey, but it isn’t a complete clinical record. For claims data analysis, a report needs a clear scope, source, refresh date, member eligibility, and population rules before anyone treats it as a decision tool. Preparation rules should also cover data normalization for dates, identifiers, and source formats, plus vocabulary mapping for payer-specific diagnosis, procedure, and pharmacy code sets.
Keep medical and pharmacy claims at their proper grain
Medical claims usually include a member identifier, service dates, provider identifiers such as NPI, place of service, ICD-10 codes including ICD-10-CM diagnosis codes, and CPT codes or HCPCS procedure codes. They also include billed charges, allowed amounts, paid amounts, and adjudication status. Keep claim headers and claim lines separate because one claim can contain several billable services.
Pharmacy claims need their own structure. Useful fields include fill date, National Drug Code, quantity, days’ supply, prescriber and pharmacy identifiers, copay, paid amount, and rejection status. Joining every record into one wide table may look convenient, but it makes reimbursement analysis and audit work harder.
Treat open and closed claims as different sources
Open claims often arrive quickly through providers, clearinghouses, pharmacy benefit managers, or transaction networks. They can reveal recent activity, yet they may miss services billed through other channels or payers.
Closed claims come from payer adjudication and are usually more complete for a member’s enrollment period. However, they arrive later and stop providing a full view when a member’s health insurance coverage changes. Store the claim type, data supplier, arrival date, and service date with every load. That discipline prevents a current open-claims trend from being compared carelessly with a finalized closed-claims period.
A denial rate without a defined claim population and as-of date is an opinion, not a reliable KPI.
Build healthcare claims analytics in Microsoft Fabric
A scalable claims platform preserves source evidence while producing clean analytical tables. It should support recurring revenue cycle reporting and longer-term utilization analysis without maintaining separate copies of the same data.
Ingest raw files without losing the audit trail
Start with automated data ingestion for 837 claim transactions, 835 remittances, EHR data extracts, pharmacy files, eligibility feeds, and payer portals. These sources support claims processing.
Fabric Data Factory pipelines can record source file names, load timestamps, row counts, and failure details before transformations begin.
For repeatable low-code cleansing, a Dataflows Gen2 overview shows how Power Query transformations fit into Fabric Data Factory. A Dataflows Gen2 implementation supports repeatable data normalization for dates, payer names, identifiers, and source columns. Larger or complex transformations should run upstream in SQL or notebooks, rather than piling row-level logic into DAX.
Keep the original claim payload, adjustment details, and source values in a restricted raw layer. This evidence supports fraud detection when leaders question totals or auditors trace how a measure was calculated.
Use separate models for operations and research
A Microsoft Fabric Lakehouse provides a governed data lakehouse foundation for raw and curated claims tables. Bronze tables retain source detail, silver tables standardize identifiers and codes, and gold tables support dashboards and models. Microsoft’s medallion architecture guidance provides a practical structure for separating those layers.
A Microsoft Fabric Warehouse then supports curated fact and dimension tables for finance and reporting teams. Vocabulary mapping can align payer-specific codes across sources. Claim line facts, payment facts, denial facts, and eligibility periods work well with dimensions for payer, provider, facility, procedure, diagnosis, and calendar periods.
OMOP Common Data Model can add value when analysts combine claims with EHR data, laboratory, or research data. It standardizes concepts for observational analysis and real-world data use cases. Still, OMOP should not replace the operational claims model. Retain payer-specific denial codes, remittance information, adjustment reasons, and source values that revenue cycle management teams need.
Use claims analytics to reduce denials and rework
Reducing claim denials needs more than a monthly total. Teams need to see which payer, facility, provider, procedure, diagnosis combination, and submission rule drives avoidable denials.
Move from descriptive reporting to action
Claims data analysis moves teams from descriptive reporting to diagnostic reporting. Descriptive analytics shows denial rate, denied dollars, clean claims rate, and days in accounts receivable. Comparing clean claims rate with denied dollars and first-pass resolution reveals where rework is affecting cash flow.
Diagnostic analysis then supports root cause analysis. Examples include a registration issue at one location or missing authorization for a service category. Use vocabulary mapping to standardize payer-specific denial and reason codes before comparing results.
Predictive analytics can score claims with a higher likelihood of denial before submission. Machine learning models should use validated historical patterns, not hidden assumptions. Workflow automation can route high-risk claims to a work queue, request missing documentation, or alert a coding team. The final decision should remain with qualified staff.
The same approach can support fraud detection by flagging duplicate billing patterns, unusual provider behavior, or suspicious service combinations. A model score is a review signal, not a fraud finding.
Track denial work with a compact scorecard, segmented by payer to assess payer performance:
| KPI | What it reveals |
|---|---|
| First-pass resolution rate | Whether claims clear without rework |
| Denial rate by payer and reason | Where preventable rejection patterns appear |
| Denied dollars by aging bucket | Cash-flow exposure and appeal priorities |
| Appeal overturn rate | Whether denial follow-up recovers revenue |
A useful claims analytics program connects the scorecard to claim-level details and root cause analysis, then assigns an owner and next action for claim denials.
Govern access, privacy, and metric definitions
Claims analytics can improve care operations and financial control, but combining identifiers, dates, and payer data creates privacy risk. Governance must cover the data pipeline, analytical model, and report audience.
Apply privacy controls before broad self-service access
Use the minimum data needed for each workspace. Analysts studying population trends may need tokenized member keys and shifted dates. Revenue cycle staff may need identified records for permitted operational work. These access patterns should not share one unrestricted dataset.
HIPAA offers Safe Harbor and Expert Determination pathways for de-identification. Safe Harbor requires removing 18 identifier categories. Limited data sets can retain certain dates and geography, but they are not de-identified data and require a data use agreement. The OHDSI privacy guidance for OMOP also highlights why dates and source fields need careful treatment.
Certify the measures that executives see
Microsoft Fabric governance should define domain owners, certified tables, and approval workflows. Track code-set versions, business definitions, ownership, approval history, and vocabulary mapping as governed artifacts. These artifacts help keep payer-specific labels aligned without replacing source values. Microsoft documents how Purview works with Fabric governance to support cataloging, lineage, classification, and policy management.
Row-level security should limit facility managers to appropriate locations. Column-level controls can protect sensitive identifiers. Most importantly, publish definitions for “denial,” “paid claim,” “clean claim,” and “allowed amount” inside the model. Different definitions of one metric can erode confidence faster than a slow report.
Make Power BI reports fast enough for daily action
Power BI should sit on governed data products, not become another place where business logic is recreated report by report. The Microsoft Fabric Power BI integration works best when report authors use shared tables, common measures, and certified semantic models for consistent payer performance comparisons.
Design semantic models around claims grain
Use a star schema with claim line, payment, and eligibility facts connected to conformed dimensions. Keep calculations such as denial percentage, paid per claim, and average days to resolution as DAX measures. Avoid loading every descriptive field into every visual.
Fabric semantic models need documented relationships, clear filter paths, and useful synonyms for business users. Include vocabulary mapping for payer, provider, and operational terms so labels stay consistent across reports. Power BI semantic model optimization also includes removing unused columns, reducing high-cardinality fields, and keeping complex transformations out of report calculations.
Manage capacity before users feel the slowdown
Microsoft Fabric performance optimization includes measuring refresh duration, query latency, concurrent report use, and workload consumption. A monthly executive dashboard may need modest resources, while timely financial performance reporting can require more frequent refreshes. High-volume claims detail can create a different demand profile.
Microsoft Fabric capacity planning should happen before a production launch, then continue as data volumes and users grow. Microsoft’s capacity planning guide outlines how to plan and govern growth. Teams that need help with refresh tuning, model design, and cost control can Optimize Fabric Performance and Cost.
Success story: How a not-for-profit health system brought its analytics together with Microsoft Fabric
A large not-for-profit health organization in the U.S. worked with Spargent’s Microsoft Fabric experts to bring all its scattered data into one managed analytics system. In just nine months, the team set up a foundation ready for clinical analytics, population health, operational and financial reporting, AI projects, and secure research.
The organization saw a return on investment by cutting out duplicate reporting, reducing manual data work, speeding up access to reliable information, and making it easier to manage data across departments. Now, claims, finance, clinical, and research teams all use the same data foundation, while still keeping the right access, governance, and data models for their needs.
By rolling out the project in phases and focusing on results, Spargent helped the organization see value early and build a strong base for future analytics and AI projects.
A delivery model that fits U.S. healthcare teams
Spargent Analytics provides Microsoft Fabric consulting services for U.S. mid-market and enterprise organizations. These teams need stronger data delivery without hiring a full internal platform team. Its Microsoft Fabric consultants work alongside existing analysts and engineers, or provide delivery capacity when no internal team exists.
A senior Microsoft Fabric expert can lead data platform modernization, analytics modernization, and Microsoft Fabric migration planning. For teams migrating to Microsoft Fabric, Spargent can scope a Power BI to Microsoft Fabric migration, protect critical reports, and improve the data architecture before moving workloads.
As a Microsoft Fabric implementation partner, Spargent delivers Microsoft Fabric data engineering services across the claims lifecycle. This includes support for revenue cycle management workflows, Fabric Data Factory consulting, Dataflows Gen2 implementation, Microsoft Fabric Lakehouse and Warehouse design, OneLake consulting, Fabric semantic models, Power BI semantic model optimization, and Fabric Real-Time Intelligence for timely operational alerts.
Microsoft Fabric analytics consulting also covers Microsoft Fabric governance, performance tuning, and Microsoft Fabric managed services after go-live. For organizations seeking data engineering consulting in the USA or Microsoft Fabric consulting in the USA, Spargent brings senior European engineers to U.S. engagements. Clients gain efficient delivery, direct communication, and better ROI than many USA-only consulting models.
A focused assessment can identify weak claims pipelines, conflicting measures, capacity risks, and the quickest path to trusted reporting. Book a Microsoft Fabric Discovery Call to review the current environment and prioritize the next step.
Frequently Asked Questions
What is healthcare claims analytics?
Healthcare claims analytics is the use of claims data to understand reimbursement, denials, utilization, accounts receivable, and payer performance. It combines governed data preparation with reporting and analysis that support operational decisions.
How can claims analytics help reduce denials?
Claims analytics identifies denial patterns by payer, facility, provider, procedure, diagnosis, and submission rule. Predictive scoring can flag higher-risk claims before submission, while diagnostic reporting helps teams address root causes and assign follow-up actions.
Why should medical and pharmacy claims remain separate?
Medical and pharmacy claims use different fields, business processes, and analytical grains. Keeping them separate preserves data quality and makes reimbursement, utilization, and audit analysis easier to manage.
How does Microsoft Fabric support healthcare claims reporting?
Microsoft Fabric can ingest claims transactions, remittances, eligibility data, pharmacy files, and other sources while preserving source evidence. Lakehouse and Warehouse layers then support curated tables, governed semantic models, and Power BI reports.
What governance is needed for claims analytics?
Governance should define access by audience, protect identifiers, document metric definitions, track code-set versions, and preserve lineage from source to report. Row-level security, column-level controls, and certified measures help teams use claims data responsibly.
Build trust before adding more dashboards
Claims reporting becomes useful when its information is complete enough for the question, governed for the audience, and traceable to the source. A well-structured Fabric environment gives finance and clinical operations the same trusted definitions without exposing sensitive records unnecessarily.
This governed analytics approach earns its value when teams can explain a number, identify the responsible process, and act before a denial becomes aging debt.
