

Late reports, disconnected spreadsheets, and slow answers are a bad fit for supply chain work, especially when demand, inventory, shipping, and production can change by the hour. Microsoft Fabric for supply chain analytics brings data integration, warehousing, real-time analytics, Power BI, and AI into one SaaS platform, with OneLake as the shared data foundation.
That matters when you need trusted numbers fast, not another round of manual reconciliation. If you’re sorting out reporting bottlenecks, planning a Fabric rollout, or trying to get more out of Power BI and your existing Microsoft stack, Book a Microsoft Fabric Discovery Call with Spargent Analytics, a Microsoft Fabric consulting and delivery partner built for US mid-market and enterprise teams, delivered by senior European engineers with a strong cost-to-ROI advantage.
What Microsoft Fabric means for supply chain analytics
Supply chain teams do not usually struggle because they lack data. They struggle because the data keeps arriving in pieces. Orders sit in one system, inventory in another, shipping updates show up later, and planning teams patch the rest together in Excel.
Microsoft Fabric changes that setup by putting ingestion, transformation, storage, analytics, and reporting on a shared foundation. For supply chain leaders, that means fewer handoffs, fewer copies of the same file, and a much cleaner path from raw data to a decision someone can actually use.
Why supply chain data gets messy so quickly

Supply chain data breaks down fast because every team tends to work from its own version of the truth. Procurement has supplier numbers, operations has fulfillment status, finance has cost data, and the planning team may have its own spreadsheet that nobody else fully trusts.
That creates a familiar mess:
-
- Duplicate spreadsheets that get emailed around and edited by different people
-
- Delayed refreshes that make dashboards feel stale by the time they land
-
- Manual reconciliations that eat hours every week
-
- Conflicting numbers for inventory, order status, or service levels
-
- Local workarounds that solve one team’s problem while making cross-team reporting harder
The real pain is not technical. It shows up in meetings, where people spend more time arguing about the number than acting on it. If your inventory view is wrong, your shipping plan is late. If your demand signal is stale, your replenishment decision is off. That is how small data gaps turn into expensive operational misses.
For a closer look at how fragmented supply chain data creates traceability problems, this overview of supply chain traceability challenges gives a useful external reference point.
How Fabric brings planning, operations, and reporting into one place
Fabric gives supply chain teams one place to bring data in, shape it, store it, and report on it. Data can flow through Fabric pipelines or Dataflows Gen2, land in OneLake, then move into a Lakehouse or Warehouse for analysis without bouncing between separate products and storage layers.
That shared base matters because supply chain metrics are connected. Inventory affects order fill rate. Supplier performance affects shipping reliability. Demand trends affect production planning. When those pieces live in the same Fabric environment, it becomes much easier to keep Power BI reports aligned with the same numbers operations and planning teams use.
The practical payoff is straightforward:
-
- Faster reporting, because teams are not waiting on a chain of manual exports.
-
- Better visibility, because inventory, orders, shipping, and supplier data can be read together.
-
- Cleaner governance, because the same data foundation supports semantic models and trusted metrics.
-
- Less friction, because Power BI sits on top of a shared platform instead of another disconnected reporting layer.
That is where Microsoft Fabric becomes more than a reporting tool. It becomes the operating layer for supply chain analytics, with OneLake, semantic models, real-time analytics, and Power BI working from the same source of truth. For teams trying to reduce manual work and improve decision speed, that shift is hard to ignore.
If your current reporting stack is stitched together from spreadsheets, exports, and aging pipelines, Book a Microsoft Fabric Discovery Call to review the current setup and map the next step for your supply chain data environment.
The supply chain problems Microsoft Fabric can help solve
Supply chain teams usually do not need more data. They need cleaner data, faster data, and a way to trust the number on the screen without a second round of spreadsheet checks. That is where Microsoft Fabric fits well. It helps connect operations, finance, procurement, logistics, and reporting on one governed foundation, so the business can work from the same facts.

The biggest problems in supply chain analytics are rarely isolated. A late shipment affects inventory, inventory affects service levels, service levels affect revenue, and finance needs the same story to close the loop. Fabric helps because it keeps the data, the model, and the report layer aligned instead of scattered across disconnected tools.
Get one version of the truth across every supply chain team
A supply chain often breaks down at the handoff points. Finance wants margin and landed cost. Operations wants fulfillment and throughput. Procurement wants supplier performance. Logistics wants shipment status and exception alerts. If each team is pulling from a different spreadsheet or a different refresh cycle, the meeting starts with arguments, not action.
Fabric helps put the same governed data model behind those teams. Data can land in OneLake, flow through Data Factory or Dataflows Gen2, and feed a Lakehouse, Warehouse, or semantic model that Power BI can reuse. That means the inventory number in operations can match the financial view, the shipment metric in logistics can match the dashboard in leadership, and the business stops wasting time reconciling basic facts.
This is where Microsoft Fabric and Power BI work best together. Fabric gives the shared data foundation, while Power BI gives each team the view it needs without breaking the model underneath. Microsoft documents this as part of its supply chain reference architecture, which is built around shared data and real-time decision support (Supply chain reference architecture).
When the data model is shared, the conversation changes from “which number is right?” to “what should we do next?”
See problems as they happen, not after the day is over
Supply chain issues age badly. A stockout that sits unnoticed until the afternoon has already cost sales. A late carrier update can ruin a pick, pack, and ship plan. A machine event on the floor can ripple into missed orders before anyone refreshes a dashboard.
Fabric helps teams see those signals in near real time. Real-Time Intelligence can ingest streaming events, monitor changes, and surface exceptions while there is still time to act. That matters for late shipments, order spikes, equipment events, inventory drops, and POS anomalies because supply chain work moves on hours, not days.

A faster signal means a faster response. You can reroute shipments, rebalance inventory, change replenishment timing, or flag an exception before it spreads across the rest of the network. Microsoft has highlighted similar supply chain scenarios in its Fabric updates, where unified data and live analytics shorten the gap between event and action (advancing supply chain analytics with Fabric).
Cut manual Excel work and reduce reporting delays
A lot of supply chain reporting still runs on copy, paste, and hope. Someone exports a file, another person cleans it up, a third person updates formulas, and then the dashboard gets refreshed after the meeting already started. That cycle burns time and creates errors nobody wants to own.
Fabric and Power BI replace a lot of that repeat work. Instead of rebuilding reports every week, teams can connect reporting directly to governed data in OneLake, then use semantic models and Power BI reports that refresh from the same source. That reduces spreadsheet drift, cuts duplicate effort, and keeps reports closer to the operational truth.
For teams that still rely on manual reporting, the payoff is easy to see:
-
- Fewer spreadsheet handoffs, because the reporting layer sits on shared data
-
- Less copy and paste, because transformations live in Fabric instead of scattered files
-
- Faster refresh cycles, because reports can connect to live or near-live data
-
- Cleaner executive reporting, because finance and operations are pulling from the same model
That is also where Spargent Analytics fits in. For US-based mid-market and enterprise teams, Spargent helps design, implement, migrate, optimize, and support Microsoft Fabric across the full stack, including Data Factory pipelines, Dataflows Gen2, Lakehouse, Warehouse, OneLake, Power BI, semantic models, governance, real-time analytics, and managed support. Built for US companies, delivered by senior Microsoft Fabric experts from Europe, the model gives you strong communication, practical delivery, and better ROI than a bloated US-only consulting setup.
If your supply chain reporting is still held together by spreadsheets and refresh delays, Book a Microsoft Fabric Discovery Call to review the current setup and map the fastest path to better visibility.
How Fabric supports a modern supply chain analytics flow
A modern supply chain analytics flow works best when the data stops bouncing between tools. Microsoft Fabric keeps ingestion, transformation, storage, reporting, and real-time action in one place, so supply chain teams can move faster without rebuilding the same logic in five different systems.
That matters because supply chain data rarely lives in one system. ERP, WMS, TMS, IoT sensors, supplier portals, and partner feeds all produce useful signals, but they arrive at different speeds and in different formats. Fabric gives you a way to bring those signals together, shape them into trusted views, and push them into Power BI or real-time workflows without constant copy-paste work.

Bring in data from ERP, WMS, TMS, IoT, and partner systems
Fabric fits supply chain environments because it connects to many source types without forcing everything through one brittle path. Data can come from cloud apps, on-prem systems, streaming devices, or external partner platforms, then land in OneLake, the shared data foundation for Fabric. Microsoft also supports no-copy access patterns, so teams can work with external data without creating more versions of the same dataset.
That flexibility matters in real supply chain work. Your ERP may hold orders and finance data, your WMS may track inventory and warehouse events, your TMS may manage shipments, and IoT devices may generate live signals from the floor or the field. Fabric can bring those sources together through methods like pipelines, event streams, mirroring, and shortcuts, which is a lot cleaner than stitching every source into a separate point solution.
A practical flow often looks like this:
-
- Ingest operational data from core systems and partner feeds.
-
- Land it in OneLake so teams are working from a shared foundation.
-
- Expose it to the right workloads for engineering, warehousing, analytics, or reporting.
-
- Keep the source of truth intact instead of copying the same data into separate tools.
For teams with hybrid and multi-cloud environments, that structure cuts friction fast. It also makes it easier to scale reporting later, because the data foundation is already in place. Microsoft’s OneLake overview explains how Fabric centralizes data across workloads without forcing every team into a separate storage layer.
Transform raw data into useful supply chain views
Once the data is in Fabric, the next step is turning raw operational records into something the business can actually use. That is where Dataflows Gen2, notebooks, pipelines, Lakehouse patterns, and Warehouse patterns come in. Each one has a place, depending on whether you need low-code shaping, code-first transformation, or a more structured analytics model.
For example, a planning team might need a clean inventory view that combines stock on hand, safety stock, open purchase orders, and inbound shipments. A logistics team may need a fulfillment view that ties order status to carrier events and delay reasons. A supplier team may want a performance view that tracks lead times, missing ASN events, and late deliveries. Fabric supports all of those without pushing the logic into disconnected spreadsheets.

The strength here is not just transformation, it is reuse. When the same cleaned dataset feeds a Lakehouse, a Warehouse, and a Power BI model, teams stop rebuilding the same rules over and over. That lowers maintenance, reduces drift, and gives you one set of definitions for the business to trust.
If the raw feed is messy, Fabric helps you standardize it before it becomes a reporting problem.
This is also where a proper implementation partner matters. Spargent Analytics helps US-based mid-market and enterprise teams design and implement Fabric pipelines, Dataflows Gen2 logic, Lakehouse and Warehouse structures, and the supporting governance model. The point is not to add more tooling, it is to turn scattered supply chain data into a stable analytics layer your teams can keep using.
Build trusted Power BI dashboards and semantic models
A dashboard is only as good as the model behind it. In supply chain reporting, that means the KPI definitions need to stay stable across teams, regions, and business units. Fabric semantic models help with that by creating a shared layer for metrics like fill rate, on-time delivery, backorders, forecast accuracy, and inventory turns.
That consistency matters more than it sounds. If operations calculates fill rate one way and finance calculates it another way, the dashboard becomes a debate starter. With a semantic model in Fabric, you define the metric once, then reuse it in Power BI reports, executive scorecards, and downstream analysis.
A good supply chain semantic model usually does three things well:
-
- Standardizes KPI logic so every team sees the same number
-
- Simplifies report building so analysts are not recreating formulas in every dashboard
-
- Improves trust because the metric definition is documented and governed
Power BI then becomes the presentation layer, not the place where business logic gets reinvented. That makes reports easier to maintain and far more reliable during month-end close, inventory reviews, and executive operating meetings.
For teams modernizing old reporting stacks, this is often the point where Fabric starts to pay off quickly. If you want to move existing Power BI assets into a cleaner foundation, Plan Your Power BI to Fabric Migration is the right next step. Spargent can help align semantic models, workspace structure, and governance so reports stay consistent as usage grows.
Use real-time intelligence for alerts and fast action
Supply chain problems rarely wait for a scheduled refresh. A stockout, shipment delay, production event, or sensor alert can change the situation in minutes. Fabric’s Real-Time Intelligence supports streaming data, live monitoring, and exception handling so teams can respond while the issue is still active.
That can mean alerting a planner when inventory drops below threshold, flagging a late carrier event, or triggering an operational response when a warehouse or IoT signal changes. Instead of waiting for the next batch run, the team sees the event as it happens and can act on it right away.
The real value here is speed with context. Real-time data is useful only when it is tied back to the right business view. Fabric does that by connecting live events to the same data foundation used for reporting and analysis, which helps teams move from detection to response without switching systems.
That is a strong fit for supply chain operations where delays are expensive and small exceptions can spread fast. If your current setup gives you updates too late to act, Book a Microsoft Fabric Discovery Call and map out the quickest path to real-time visibility with a cleaner Fabric architecture.
Built right, this flow gives you one practical chain of value, source systems in, governed data in OneLake, trusted models in Power BI, and real-time alerts when the business needs to move now.
Supply chain use cases where Fabric creates immediate value
Microsoft Fabric fits best where supply chain teams need faster answers, cleaner data, and less manual reporting. The biggest gains usually show up early, especially when teams are juggling inventory pressure, shipment risk, demand swings, and supplier delays at the same time.
The point is not to rebuild every process on day one. It is to connect the highest-value data first, get trusted visibility into the numbers that matter, and give operations, planning, and leadership one place to act. That is where Fabric starts paying off quickly.
Inventory and stockout visibility
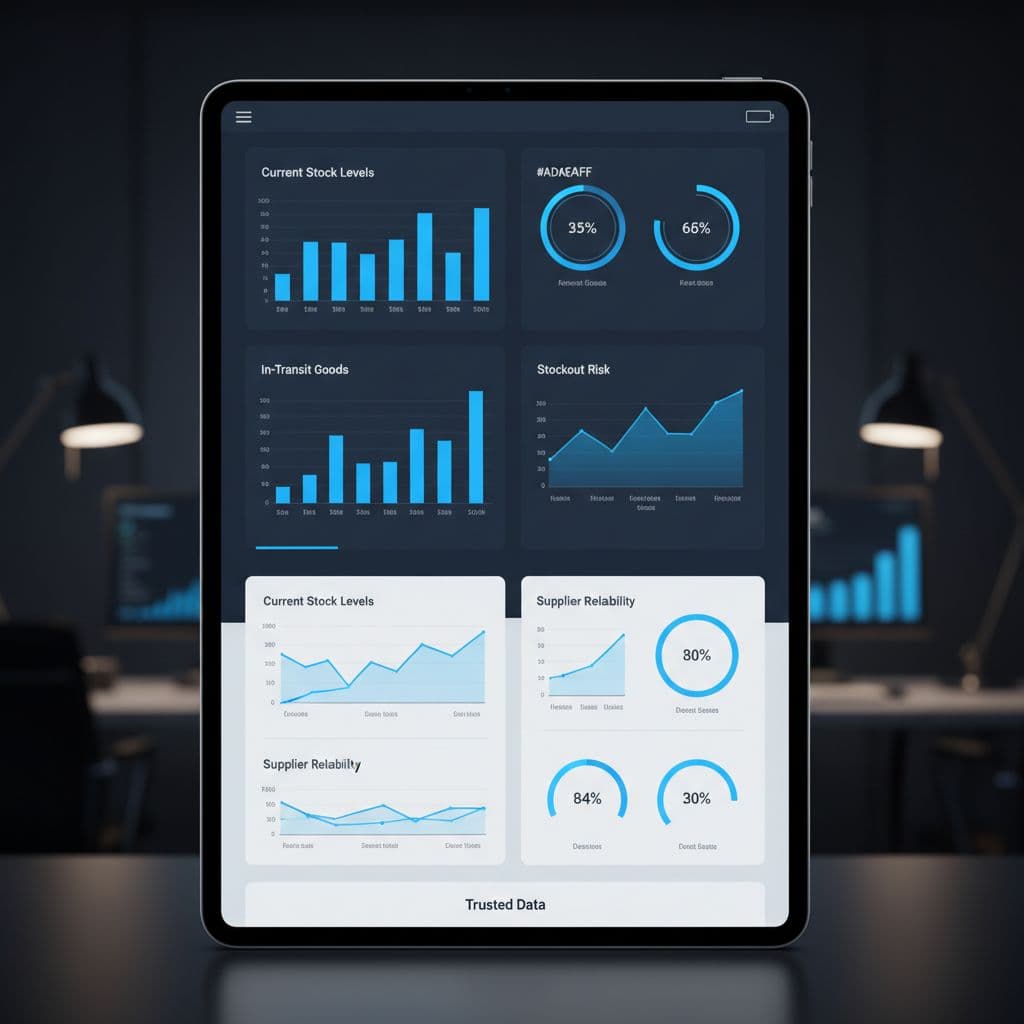
Inventory problems get expensive fast when the team finds them late. Fabric helps pull stock data, open orders, inbound shipments, and store or warehouse events into one governed view, so shortages surface sooner and teams can act before sales are lost.
That matters for more than just replenishment. If a product is running low in one location but sitting idle in another, the right data view can trigger transfers, change reorder timing, or flag a rush order before the customer feels the gap. When inventory signals live in Fabric and flow into Power BI or real-time alerts, the conversation changes from cleanup to action.
A practical inventory setup in Fabric usually helps teams:
-
- Track stock on hand and safety stock in one place
-
- Spot fast-moving items before they hit zero
-
- Compare open purchase orders against actual demand
-
- Reduce emergency buys and last-minute shipping costs
-
- Give planners and store or warehouse teams the same inventory view
Microsoft’s own supply chain guidance shows how Fabric can bring operational data and real-time intelligence together for faster response, which is exactly what inventory teams need when stockouts start forming. For a closer look at the reporting side, see this Fabric supply chain dashboard example.
The faster the stockout signal reaches the team, the less money you lose trying to recover from it.
Shipment and logistics monitoring
Shipment visibility is another place where Fabric creates fast value. Logistics teams often know something is late before the rest of the business does, but the delay still needs to move through carrier updates, emails, spreadsheets, and manual follow-up. Fabric cuts that lag by bringing shipment events, route data, and service-level metrics into a live analytics flow.
That gives operations teams a clearer view of where the risk sits. Is the carrier late? Did the route change? Is an inbound load at risk of missing the dock window? With Fabric, those events can feed dashboards and alerts quickly enough to support rerouting, customer updates, or exception management while there is still time to act.
This is also where real-time monitoring matters most. A shipment delay is rarely just a shipment delay. It can ripple into inventory, production, and promised delivery dates. When live logistics data sits in the same platform as order and inventory data, teams can see the downstream impact without stitching together five reports.
A strong logistics view in Fabric can help teams:
-
- Monitor transit status and late arrivals as they happen
-
- Spot route exceptions before they become service failures
-
- Track service-level risk by lane, carrier, or region
-
- Prioritize the shipments that affect revenue or customer commitments first
The useful part is not just the alert. It is the context around the alert. Fabric gives teams the data foundation to see which delayed shipment actually matters and which one can wait.
Demand forecasting and planning
The benefit here is practical. Historical data explains the baseline, real-time data shows what is changing now, and external data fills in the gaps that old planning files miss. If a promotion is running hot, if weather is shifting traffic, or if customer demand is moving earlier than expected, the forecast can adjust sooner.
This is a good fit for Fabric because the same platform can support data prep, modeling, and reporting. Teams can build planning datasets in OneLake, use Data Science or AI tools for experimentation, and publish the result into Power BI for business users who need a forecast they can trust.
For supply chain leaders, that means planning becomes more usable in the real world. The output is not just a spreadsheet with a forecast column. It is a living view that can inform replenishment, staffing, production, and promotion decisions.
Supplier performance and risk tracking
Supplier issues often hide in plain sight until lead times slip, quality defects rise, or a single vendor starts missing commitments. Fabric helps teams centralize supplier performance data, compare trends across vendors, and see reliability in one governed place instead of across disconnected files and inboxes.
That makes it easier to track lead times, defect rates, on-time delivery, and missing shipment milestones together. When procurement, operations, and quality all work from the same model, supplier scorecards become more useful. You can see which vendors are stable, which ones need attention, and where a small delay is turning into a bigger operational risk.
Fabric is especially helpful when supplier data comes from different systems. PO records may live in ERP, quality issues in a separate tracker, and shipment confirmations in another platform. Bringing those signals together gives you a clearer picture of supplier behavior over time, not just a one-off incident.
Teams usually get more value when they can:
-
- Compare lead times by supplier and product line
-
- Watch quality issues alongside delivery performance
-
- Flag vendors with repeated misses before they disrupt planning
-
- Tie supplier reliability back to inventory and service outcomes
-
- Give sourcing and operations one shared view of risk
That is where Fabric helps reduce firefighting. Instead of reacting after the problem hits the warehouse, teams can see the pattern early and make a better sourcing or replenishment decision.
Built right, these use cases create a simple but useful pattern, one platform for data, one model for reporting, and one place to respond before small supply chain issues become expensive ones.
What a strong Fabric setup looks like for supply chain teams
A strong Microsoft Fabric setup for supply chain work is not just a stack of tools. It is a clean operating model for data, with shared definitions, governed access, and enough performance to keep up when demand, inventory, logistics, and finance all move at once.

For supply chain teams, the goal is simple. Get the right data in one place, keep it trustworthy, and make it useful fast. That means fewer duplicate files, fewer broken refresh chains, and fewer meetings where everyone argues over a different version of the same metric.
Start with the right data foundation
Before you scale analytics, the source data has to be clean enough to trust and structured enough to reuse. If orders, inventory, shipments, and supplier data all arrive with different definitions, different refresh cycles, and different owners, Fabric just becomes a faster way to publish confusion.
The better approach is to start with clear ownership and a shared model. One team owns the inventory feed, another owns shipping status, another owns supplier master data, and everyone works from the same business definitions. That matters because supply chain metrics are connected, and a mismatch in one layer can throw off planning, finance, and operations.
In Fabric, that foundation usually means:
-
- OneLake as the shared store, so teams are not copying the same dataset into multiple places
-
- Standardized ingestion, so ERP, WMS, TMS, and partner feeds land with consistent structure
-
- Shared semantic models, so inventory, fill rate, and on-time delivery mean the same thing everywhere
-
- Reusable transformation logic, so the same cleanup work is not rebuilt in every report
If the foundation is weak, every dashboard becomes a custom repair job.
Microsoft’s own supply chain architecture for Fabric is built around this idea, with real-time intelligence and shared data working together instead of sitting in separate silos, Supply chain reference architecture.
A strong setup also makes it easier to add AI later. Fabric works best when the underlying data is already organized, governed, and ready for analysis. If you want help mapping that base correctly, Request a Fabric Readiness Assessment is a practical first step for US teams planning a rollout.
Design for governance and security from day one
Supply chain data is often sensitive. It can include supplier pricing, customer shipments, route information, inventory positions, and partner records. If the wrong people can see the wrong data, the problem is bigger than reporting quality, it becomes a security and compliance issue.
That is why governance cannot come after the dashboards. It has to be built into the Fabric design from the start, with access rules, lineage, classification, and auditability planned upfront. Microsoft’s Fabric guidance on governance is clear that data management needs to cover usability, integrity, and security together, not as separate projects, What is Data Governance?.
For supply chain teams, the practical checklist looks like this:
-
- Role-based access for planners, analysts, operations managers, and executives
-
- Sensitive data controls for supplier contracts, pricing, and customer-linked records
-
- Lineage visibility so teams can trace a KPI back to its source
-
- Consistent compliance handling for regulated operations and partner data
-
- Workspace and domain design that keeps ownership clear across business units
This matters even more when multiple regions, vendors, or external partners touch the same data. A governed setup helps the business share data without opening the door too wide. It also makes audits less painful, because the history of the data is visible instead of buried in email threads and spreadsheet versions.
Spargent Analytics helps US mid-market and enterprise teams design Fabric security and governance around real operating needs, not generic templates. That includes OneLake security, workspace structure, semantic model controls, and policies that fit the way supply chain teams actually work. Built for US companies. Delivered by senior Microsoft Fabric experts from Europe.
Plan for performance, scale, and cost control
Supply chain reporting tends to grow in stages. First it’s a few dashboards. Then it becomes regional reporting. Then someone wants live inventory, carrier events, and refreshes every few minutes. If the capacity plan is weak, performance drops and costs climb at the same time.
That is why capacity planning matters as much as data modeling. Fabric works best when workloads are designed with intent, so heavy refreshes do not collide with executive reporting or real-time workloads. The goal is to keep the platform responsive without paying for more compute than the business needs.
A strong performance plan usually includes:
-
- Right-sized capacity, based on report usage, refresh frequency, and streaming volume
-
- Workload separation, so pipelines, semantic models, and real-time data do not compete unnecessarily
-
- Refresh optimization, so you avoid repeated full loads when incremental patterns will do
-
- Model tuning, so Power BI reports stay fast as the data volume grows
-
- Ongoing monitoring, so you catch bottlenecks before users start complaining
Microsoft also calls out the need to manage permissions and capacity carefully in Fabric governance baselines, especially when high-cost resources are involved, Fabric Governance and Security Baselines. That guidance lines up with what supply chain teams feel in practice, because report spikes and near-real-time demand can expose a poorly planned setup fast.
A good Fabric environment should not only be fast, it should stay predictable as usage grows. That means finance can trust the cost model, operations can trust the refresh timing, and analysts can trust that a new dashboard will not slow down the old one.
When the setup is done well, supply chain teams get the same thing every time, cleaner data, safer sharing, faster reporting, and a platform that can grow without turning into a maintenance project. If your current setup is already feeling stretched, Optimize Fabric Performance and Cost is the right next move.
Conclusion
Microsoft Fabric gives supply chain teams a cleaner way to work with data. It pulls ingestion, pipelines, OneLake, Power BI, semantic models, and real-time analytics into one platform, so reporting gets faster, visibility improves, and teams spend less time fixing spreadsheets.
For organizations still stuck with scattered tools, slow refreshes, or brittle Power BI setups, the next step is usually a Fabric plan that fits the business, not more one-off fixes. If you’re considering Fabric, migrating from fragmented reporting, or modernizing your data pipelines, Book a Microsoft Fabric Discovery Call or Request a Fabric Readiness Assessment.
Spargent Analytics helps US-based mid-market and enterprise teams design, implement, migrate, optimize, and support Microsoft Fabric across the full data lifecycle, including Data Factory pipelines, Dataflows Gen2, Lakehouse, Warehouse, OneLake, Power BI, semantic models, governance, real-time analytics, and managed support. Built for US companies. Delivered by senior Microsoft Fabric experts from Europe.
