
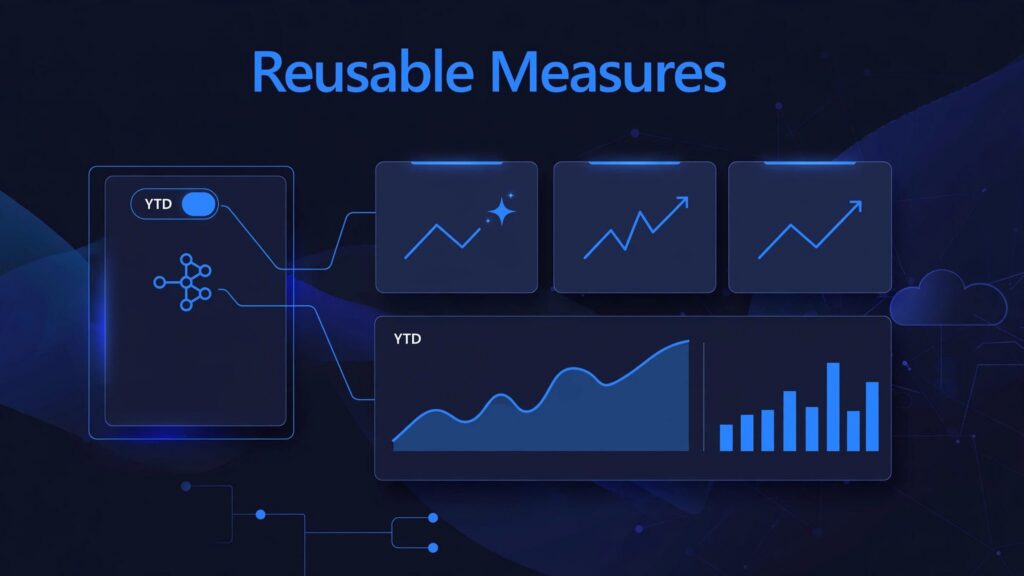
Power BI calculation groups let you write reusable DAX transformations once and apply them to existing measures. Instead of maintaining separate Sales YTD, Profit year-to-date, and Orders year-to-date formulas, you maintain one YTD calculation item.
That reduces maintenance effort, especially when reporting requirements change across departments. However, calculation groups belong to individual semantic models, so reuse across models requires shared architecture or controlled deployment.
Start with explicit measures and a reliable date table, then build the reusable transformations.
How Power BI calculation groups reduce duplication
A calculation group appears as a table with one visible column. Its rows are calculation items, such as Current, period-to-date, and YoY %.
Each item uses SELECTEDMEASURE() as a placeholder for whichever explicit measure the visual evaluates. A regular measure defines a business metric; a calculation item transforms that metric.
Four periods, three currencies, and four base measures create 48 combinations. Two calculation groups can replace the need for 48 separately maintained measure variants.
Key takeaways
- Keep business definitions in explicit base measures.
- Apply reusable period, currency, or display logic through calculation items.
- Standardize deployment because groups don’t synchronize automatically across models.

Create a calculation group in Power BI Desktop
Prepare explicit measures and dates
Create measures through New measure, including simple aggregations such as Sales = SUM('Sales'[SalesAmount]). Fully qualified column references distinguish source fields from measure references. Use measures created in the model because implicit measures generated by visuals aren’t compatible with calculation groups.
For these examples, 'Calendar'[DateKey] must contain actual dates, despite its name. Use a complete, marked date table with an active relationship to the transaction date. An integer key such as 20261120 isn’t suitable for these classic time-intelligence expressions.
Enable the group without Tabular Editor
Open Power BI Desktop and go to Model view. In Model view, select Calculation group on the ribbon, or right-click in the Fields or Data pane and choose New calculation group.
If Discourage implicit measures is off, Power BI prompts you to enable it. This prevents new implicit aggregations created by dragging raw numeric columns into visuals. Calculation groups require explicit measures.
Name the group Time Intelligence to create a time intelligence calculation group, and rename its visible calculation group column Period. The first calculation item defaults to SELECTEDMEASURE(); rename it Current.
Microsoft’s Desktop creation guide also covers creation through TMDL view. Tabular Editor remains useful for bulk editing and automation, but isn’t required.
Add reusable time-intelligence calculation items
Select the group, add calculation items, and enter each expression in the formula bar.
These items reuse whichever base measure occupies the visual’s Values field.
| Item | DAX expression |
|---|---|
| Current | Returns the base measure unchanged. |
| YTD | TOTALYTD(SELECTEDMEASURE(), 'Calendar'[DateKey]) |
| QTD | QTD calculation for the selected measure. |
| MTD | MTD calculation for the selected measure. |
| Previous Month | CALCULATE shifts the date context back one month. |
| Previous Year | CALCULATE uses dates from the preceding calendar year. |
The same items support Sales, Orders, Returns, and Profit without repeated aggregation formulas.
However, PREVIOUSYEAR() returns the preceding calendar year. For a comparable-period YoY percentage, use a shifted date selection:
VAR PY = CALCULATE(SELECTEDMEASURE(), DATEADD('Calendar'[DateKey], -1, YEAR)) RETURN DIVIDE(SELECTEDMEASURE() - PY, PY)
Name that item YoY %. DIVIDE() returns blank when the denominator is zero or blank, avoiding a divide-by-zero error.
Assign item ordinals so Current, MTD, QTD, and comparison items appear in a useful order. Alphabetical sorting rarely matches the sequence finance teams expect.
Extend the pattern to targets and rolling profit
Reuse previous-month comparisons carefully
The Previous Month item already supports previous-month Returns, Orders, and Profit. To set a target 10% above the previous month, use:
CALCULATE(SELECTEDMEASURE(), DATEADD('Calendar'[DateKey], -1, MONTH)) * 1.1
Restrict this item with ISSELECTEDMEASURE([Orders], [Profit]). This keeps the target rule from changing Returns or unrelated percentages.
Keep metric-specific targets as regular measures when their business rules differ.
Add a 90-day rolling calculation
For a rolling total, use the last visible date as the window’s end date and include the 90 days before it. Applied to Profit, this returns rolling 90-day profit.
A rolling average needs a defined denominator: calendar days, trading days, or days with transactions. Dividing by 90 is correct only for calendar days with a complete window.
Put the calculation group into a matrix or slicer
In a matrix visual, add Product or Region to Rows, explicit measures to Values, and Time Intelligence[Period] to Columns. Filter Period to YTD, QTD, and MTD when those are the required comparisons.
Alternatively, place Period in a slicer and enable single selection. Users can switch an entire page between Current and year-to-date without selecting different measures.
Calculation items can also occupy matrix rows, which suits financial statements and narrow report layouts.
Totals still evaluate in their own filter context. They don’t necessarily sum the displayed cells. Our guide to Power BI totals and filter context explains that distinction.
Combine groups while preserving numeric formats
Set calculation group precedence deliberately
Add a second group, Display Units, with a Thousands item:
DIVIDE(SELECTEDMEASURE(), 1000)
For a direct arithmetic test, DIVIDE(1000000, 1000) must return 1000. A YoY result of 0.25 should remain 25.00%, rather than becoming 0.025%.
Set Time Intelligence precedence to 20 and Display Units to 10. When multiple calculation groups apply, their expressions nest according to precedence. Higher-precedence expressions form the outer layers, so the YoY calculation compares scaled values and returns the unchanged ratio.
The same nesting principle applies when Time Intelligence establishes the date context before Currency evaluates conversion. With daily exchange rates, conversion must happen at the appropriate date grain. A single end-period rate won’t reproduce daily conversion totals.
Microsoft’s calculation group documentation explains precedence and expression expansion.
Configure format strings separately
Set dynamic format strings for each calculation item in its Properties pane. For YoY %, use "#,##0.00%".
To preserve the underlying measure’s format, use dynamic format strings with SELECTEDMEASUREFORMATSTRING().
Adding a calculation group changes measure metadata to the variant data type. If an existing DAX expression for dynamic formatting then fails to return text, wrap that expression in FORMAT(expression, ""). The format string expression must return text.
Keep this fix inside the format-string expression. Applying FORMAT() to the numeric measure itself converts its result to text. Microsoft’s dynamic format-string guidance explains how formatting can preserve numeric values.
Troubleshoot missing groups and unexpected results
Separate visibility from connection restrictions
If a group appears missing, check Model explorer’s Calculation groups collection instead of treating the relationship canvas as the complete object list. Also check whether the group column is hidden from report authors.
A read-only live-connected report can’t create objects inside its remote model. To add a local calculation group over a live connection to Azure Analysis Services, create a composite model and place the group in its local portion.
For predictable report behavior, define noSelectionExpression as SELECTEDMEASURE() when no selection should preserve base values. Set multipleOrEmptySelectionExpression to BLANK() when ambiguous selections should display nothing.
Protect text measures and existing time logic
The error “Cannot convert value of type Text to type Numeric” can occur when arithmetic reaches a text-returning measure, producing a variant data type that can’t be converted to numeric.
Use ISSELECTEDMEASURE([Sales], [Profit]) as a whitelist, and apply multiplication or division only to those known numeric measures. Exclude text-returning measures from the list.
Use ISSELECTEDMEASURE() to bypass labels, percentages, or measures that already contain year-to-date logic. Otherwise, a time-intelligence item can apply another date transformation to an already transformed measure.
Fewer measure definitions don’t guarantee faster queries. Use Performance Analyzer and DAX Studio to identify expensive expressions. Our Power BI performance tuning checklist separates model, DAX, visual, and capacity bottlenecks.
Customer success: Edith Cowan University’s Fabric consolidation
Microsoft’s Edith Cowan University customer story reports that the university reduced costs by 50% after unifying analytics with Microsoft Fabric. The story also describes centrally managed governance carried through into Power BI. The reported cost reduction came from the broader Fabric consolidation, not from a single Power BI feature or calculation groups alone.
For teams using Power BI calculation groups, the practical lesson is to treat reusable calculations as part of a wider analytics architecture. Shared data, semantic models, and governance support more consistent reporting. Cleaning up repeated measures is one part of analytics modernization, but it doesn’t replace work on the wider platform.
Support the wider Fabric lifecycle with Spargent

At Spargent Analytics, our Microsoft Fabric consulting services connect semantic-model improvements with the data platform underneath them. We support U.S. mid-market and enterprise organizations with established analytics teams or no internal team.
Our work covers ingestion, Data Factory pipelines, Dataflows Gen2, Lakehouse, Warehouse, OneLake, semantic models, Power BI, governance, and real-time analytics. We also provide managed support across the Fabric lifecycle.
For Microsoft Fabric migration and Power BI integration, we preserve tested business definitions, reduce fragmented reporting, and cut manual Excel preparation. Stable row-level transformations belong upstream when practical, while reusable filter-context calculations belong in semantic models.
Our delivery is built around the needs of U.S. companies and provided by senior Microsoft Fabric specialists in Europe. We pair USA-market-ready delivery and clear communication with an efficient cost structure that can improve project ROI compared with USA-only staffing.
After go-live, managed services cover performance optimization, capacity planning, and operational support. Clients can improve reporting speed and cost control without hiring a complete internal data team.
Frequently asked questions
Do calculation groups organize measures into folders?
No. Display folders organize existing measures. Calculation groups change how measures evaluate.
Power Query Group By is different again: it aggregates data to a new grain and removes fields outside its grouping and aggregation definitions.
Can one group work across multiple semantic models?
A calculation group belongs to its semantic model. Shared reports can reuse that model’s group, while separate models need deployed definitions.
Use version-controlled TMDL or model templates, then adapt date references and measure exclusions. Our guidance on reducing Power BI report overload covers shared-model consolidation.
Make reusable calculations part of model design
Begin with explicit base measures and one time-intelligence group. Validate date behavior, formatting, exclusions, and precedence before adding currency or display transformations.
The lasting benefit is consistent calculation logic that report authors can reuse without maintaining dozens of measure variants.
To connect that cleanup with your broader Fabric architecture, Book a Microsoft Fabric Discovery Call to review your environment and identify the next practical step.
