
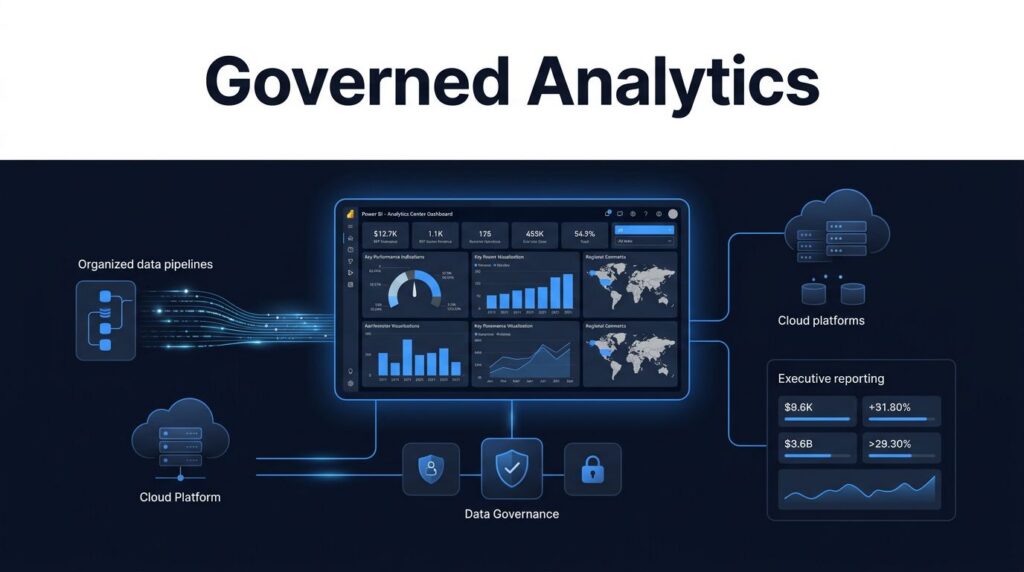
Establishing a Power BI Center of Excellence is essential because a few great dashboards do not create a data-driven company. Without shared standards, ownership, and support, reporting quickly returns to disconnected spreadsheets, duplicate measures, and arguments over which number is correct.
A durable center of excellence provides organizations with a practical way to govern analytics and help more people use trusted data. It connects business priorities with the people who build, manage, and consume reports.
The work starts by treating analytics as an operating capability rather than a collection of one-off requests, which is the foundational step toward building a sustainable data culture.
Key Takeaways
-
- A Power BI Center of Excellence requires a clear charter, accountable leadership, and measurable business outcomes to drive long-term value.
-
- Effective governance should make trusted reporting easier to build and discover, balancing control with high user adoption rather than slowing every request through rigid approval queues.
-
- Standardized semantic models, documented metrics, and reusable data pipelines are essential to reduce duplicate work and improve consistency across departments.
-
- Microsoft Fabric extends the capabilities of a Power BI Center of Excellence beyond simple reporting by unifying data engineering, real-time analytics, and governance into a single, cohesive platform.
-
- Spargent Analytics provides senior European Microsoft Fabric engineers to U.S. companies that need increased delivery capacity and a more efficient consulting cost structure.
A Power BI Center of Excellence Is an Operating Model
A Power BI CoE is not a team that owns every report. It is a coordinated group that sets guardrails, supports builders, and maintains the trusted data products the business depends on.
That distinction matters. If the CoE becomes a ticket queue, business teams work around it. If it only publishes standards, teams ignore it. A lasting model combines a centralized COE for foundational accountability with a federated model that gives departments the room to solve local reporting needs.
Microsoft’s Center of Excellence adoption guidance makes a similar point: formal reporting lines can help, but clear roles and responsibilities matter more than the label.

For most U.S. mid-market firms, the CoE should focus on four outcomes:
-
- Trust in business metrics, especially revenue, margin, inventory, utilization, patient, student, or service measures.
-
- Faster reporting delivery through reusable pipelines, semantic models, templates, and design patterns.
-
- Controlled self-service BI that lets trained users answer local questions without creating unmanaged data copies.
-
- Better ROI on the Microsoft 365, Azure, Power BI, and Fabric investments already in place.
A CoE may begin with two or three people. A BI leader, a data engineer, and a business-facing analyst can establish the first standards. As demand rises, the model can include data owners, security specialists, report developers, and domain champions.
The first decision is scope. Decide whether the group supports Power BI reporting only, or the complete data path that feeds those reports. The broader model is usually more sustainable because your business intelligence platform depends on quality source data, transformations, security, model design, and refresh reliability.
A report is only as trustworthy as the data product, business definition, and access controls behind it.
Set a Charter That Connects Reporting to Business Results
A charter prevents the CoE from becoming a vague data team. It should name the decisions the group supports, the services it provides, and the boundaries it will not cross. By establishing a clear governance framework, you ensure the organization remains aligned on how data is managed and utilized across the business intelligence platform.
Start with a small set of business problems. A manufacturer may need accurate production and margin reporting to establish a single source of truth for their financial performance. A healthcare group may need controlled access to operational measures, or a retailer may need daily sales and stock visibility. These specific needs are more useful than a broad goal such as improving analytics.
The charter should state who owns decisions about priority, data definitions, architecture, security, and release readiness. It should also establish service expectations. For example, a critical certified dataset may have a stricter refresh and support target than a departmental prototype.
Use a compact scorecard to show whether the CoE is improving work, not merely producing reports.
| Measure | What it shows | Example direction |
|---|---|---|
| Certified model adoption | Whether teams use shared trusted data | More active consumers of governed models |
| Report duplication | Whether teams rebuild the same logic | Fewer overlapping reports and datasets |
| Delivery lead time | Whether requests move faster | Shorter time from approved need to release |
| Refresh reliability | Whether critical reporting is dependable | Fewer failed or late refreshes |
| Manual reporting effort | Whether automation is replacing spreadsheet work | Fewer hours spent assembling recurring reports |
Avoid measuring success by dashboard count. A company can publish hundreds of reports and still lack a reliable view of sales, operations, or finance. Measure use, trust, speed, and the removal of manual work.
The charter should also include a funding model. Some organizations fund a central platform team, while business units fund domain-specific delivery. A blended approach often works well. Central funding covers governance, shared data assets, training, and platform operations. Departments sponsor reports and data products tied to their own goals.
Build a Team With Clear Roles and Real Authority
A CoE works when responsibilities are visible. People do not need identical technical skills, but they do need agreement on who decides what.
An executive sponsor removes barriers and keeps the CoE tied to business priorities. A CoE lead manages the roadmap, standards, intake process, and stakeholder communication. Data owners approve definitions and quality expectations for their domains, while COE champions act as subject matter experts within those functional areas. Platform specialists and the Power BI admin handle architecture, security, capacity, and deployment practices.
Business analysts and report developers translate questions into usable experiences. Meanwhile, power users can build within approved workspaces and use certified data products. This is a practical balance between central control and self-service.
A Power BI CoE framework can help teams shape roles, governance, and adoption activities. Still, no framework replaces regular conversations between finance, operations, IT, and the people using reports every day.
Establish a simple operating rhythm:
-
- Review intake and priorities every week with business and technology owners.
-
- Hold a monthly governance forum for security, model certification, user adoption, and platform decisions.
-
- Run office hours for report creators and business users.
-
- Publish standards, approved templates, metric definitions, and release notes in a central knowledge hub.
Training and mentoring belong in the operating model. Many users know Excel well and can learn Power BI quickly because both products share familiar analytics concepts. Yet Excel habits can create problems when people import private copies of data, calculate core metrics in individual workbooks, or distribute reports without access controls.
Teach creators the full Power BI workflow. They should understand Power Query for extraction and transformation, model view for relationships, DAX measures for calculations, and report view for visual communication. They should also know when to use a shared semantic model instead of importing another copy of the same data.
Standardize the Data-to-Report Lifecycle
The most useful CoEs make the right path easier than the risky path. That means providing reusable patterns for how data enters the platform, how teams transform it, and how reports reach users.
Begin with data intake. Following best practices for data intake, each source should have an identified owner, known refresh expectations, data classification, quality checks, and a documented business purpose. A dashboard request that lacks those basics is not ready for development.
Next, separate data preparation from report design. This separation is a fundamental aspect of sound data architecture. Power Query can clean files, merge sources, reshape tables, profile data quality, and automate recurring transformation work. However, reports should not become the only place where business logic lives. Relying on semantic models rather than repeating transformations inside many PBIX files prevents conflicting results and makes long term maintenance much more cost effective.
A mature workflow usually includes the following progression:
-
- Connect to controlled source systems and document lineage, owners, and sensitivity.
-
- Transform and validate data in shared pipelines or dataflows.
-
- Build a relational model with clear relationships, cardinality, and filter behavior.
-
- Define reusable DAX measures for approved business metrics to ensure consistency across certified datasets.
-
- Publish reports that use those governed models, leverage deployment pipelines for consistent release management, and then monitor adoption and issues.
This lifecycle also improves design quality. Following best practices for visual design ensures that your reports are both functional and intuitive. A line chart suits time series performance, while a map can clarify geography. A crowded visual that tries to answer five questions usually answers none of them well. Every report should identify its audience and the decision it supports.
Use certification carefully. Certify a data product when it has a defined owner, tested calculations, appropriate security, support coverage, and clear documentation. Promotion can identify useful content that is still being evaluated. Keep the distinction meaningful.
For structure ideas, review this Power BI Center of Excellence playbook. Your own standards should remain short enough that business teams will use them.
Extend the CoE With Microsoft Fabric
Many companies start their Center of Excellence around dashboards, only to realize their most significant challenges sit upstream. Data arrives via manual extracts, tables are duplicated across various tools, and engineering and BI teams often work in isolated environments. A comprehensive Microsoft Fabric strategy gives the CoE a shared platform for analytics modernization, helping to break down these silos.
Microsoft Fabric integration connects report delivery with data engineering, storage, governance, and real-time workloads. Power BI remains the business facing experience, while Fabric supports broader operations across the entire data lifecycle.
A Microsoft Fabric Lakehouse can support engineering and analytical workloads with shared data access, while a Microsoft Fabric Warehouse provides a governed, SQL oriented environment for structured reporting. Through deliberate OneLake consulting, teams can plan workspace structure, shortcuts, security, and ownership before duplication becomes the default. By following a structured Fabric adoption roadmap, organizations can ensure these technical choices align directly with business needs.
Expert data engineering services can help teams replace brittle manual imports with managed pipelines. A Dataflows Gen2 implementation standardizes reusable transformations for business friendly data preparation, while robust data engineering practices maintain the ingestion, testing, and orchestration required to keep critical data current.
The CoE should also establish best practices for semantic models. These models provide sales, finance, and operations teams with a single source of truth for common measures. Semantic model optimization improves refresh performance and report response time, which is essential as models grow in complexity or serve more users.
Real-time needs require distinct design decisions. Fabric Real-Time Intelligence is ideal for monitoring events, applications, or transactions with low latency, though it should not be the default architecture for every reporting requirement. A static daily finance report has different needs than an operations dashboard tracking live conditions.
For organizations planning a Microsoft Fabric migration, begin with a thorough inventory. Identify active workspaces, high-value reports, unsupported data sources, and current capacity usage. This is the time to apply best practices: decide which assets should be retired, repaired, or redesigned. A successful migration should improve the operating model rather than simply moving existing disorder into a new service. Companies that migrate without first resolving ownership and governance often carry their old reporting problems forward.
Spargent Analytics provides Microsoft Fabric consulting services for organizations that need practical support across ingestion, data engineering, OneLake, Lakehouse, Warehouse, semantic models, and real-time analytics. Our senior consultants work with stakeholders in a delivery model built for clear communication, strong technical depth, and high efficiency.
For a data platform modernization roadmap that ties architecture to reporting outcomes, Book a Microsoft Fabric Discovery Call.
Make Governance, Performance, and Support Part of Daily Work
Microsoft Fabric governance cannot wait until the platform grows. Establish a robust governance framework early to define workspace roles, access review routines, sensitivity labels, row-level security, and data retention expectations. Effective workspace management ensures teams have a clear route to publish useful analytics while following security best practices to prevent the exposure of sensitive information.
Governance should also cover semantic consistency. The CoE needs a business glossary for terms such as active customer, net revenue, available inventory, completed order, or margin. Each definition should have an accountable owner. When departments use different logic for the same metric, no visualization can repair the resulting confusion.
Performance and cost need regular attention. Microsoft Fabric capacity planning should account for interactive report demand, scheduled refreshes, engineering workloads, data volume, and peak business periods. A capacity that feels adequate during testing can struggle once hundreds of users open reports at 9:00 a.m.
Optimizing Microsoft Fabric performance requires adhering to established best practices, including reviewing refresh duration, query patterns, model size, incremental refresh settings, and workspace design. It also requires report discipline. Too many high-cardinality visuals, inefficient DAX, or unrestricted cross-filtering can make an otherwise solid model feel slow. Consistent workspace management is vital here, as it allows administrators to monitor capacity metrics and track report usage effectively.
A Microsoft Fabric expert can help distinguish a capacity problem from a modeling problem. This matters because buying more capacity will not fix every slow report. Conversely, endless tuning cannot compensate for inadequate capacity during heavy use.
After go-live, Microsoft Fabric managed services provide a practical option for companies without a full internal data team. Managed support can cover monitoring, incident response, release management, security reviews, user support, and a backlog of improvement work. This approach also incorporates training and mentoring to reduce dependence on one internal analyst who knows every dataset and refresh schedule.
Spargent works as a Microsoft Fabric implementation partner for U.S. companies that need an experienced extension of their internal team, or need a team built around their existing business owners. Its Microsoft Fabric analytics consulting, Microsoft Fabric consulting USA, and data engineering consulting USA services combine senior European delivery talent with U.S.-market-ready project communication and accountability.
When capacity, refresh reliability, or model performance needs attention, Optimize Fabric Performance and Cost.
Short Success Story: Regional Retailer and Near Real-Time Reporting
Our client, a mid-size regional retailer from the USA, adopted Microsoft Fabric with Real-Time Intelligence to replace slower, preparation-heavy analytics based on transactional data. By centralizing data in OneLake, the company established a single source of truth that powers live reporting in Power BI for sales trends, promotions, inventory, and staffing decisions.
The move reduced delays caused by repeated data transfers and refresh cycles. It also gave operational teams a more current view of activity while strengthening the foundation for governed reporting and future forecasting work within the Microsoft Fabric ecosystem.
The lesson for a Power BI CoE is direct: the strongest reporting programs connect a reliable single source of truth with the daily decisions that drive business performance.
Frequently Asked Questions
What is the primary purpose of a Power BI Center of Excellence?
A Power BI CoE acts as an operating model that defines standards, guardrails, and support structures to ensure data consistency across an organization. Instead of just building dashboards, it focuses on creating reliable data products and fostering a data-driven culture where teams can perform self-service analytics with confidence.
How does a Center of Excellence balance central control with user freedom?
It utilizes a hybrid approach that combines centralized governance for foundational data models and metrics with a federated model for department-specific reporting. This ensures that essential business definitions remain standardized while individual teams retain the agility to solve local business problems without waiting for a central ticket queue.
Who should be included in a CoE team?
A successful CoE starts with a small group, typically including a BI lead, a data engineer, and a business-facing analyst. As the program matures, it often expands to include executive sponsors, data owners, security specialists, and dedicated CoE champions within different business departments to drive adoption.
How does Microsoft Fabric change the role of the CoE?
Microsoft Fabric unifies data engineering, storage, and analytics into a single platform, allowing the CoE to manage the entire data lifecycle rather than just the reporting layer. By integrating these services, the CoE can reduce data duplication and improve the reliability of the source data feeding into Power BI, resulting in a more cohesive and efficient analytics ecosystem.
Build the Capability, Then Keep Improving It
A lasting Power BI Center of Excellence creates a dependable path from raw data to business decisions. It establishes a healthy data culture by providing shared definitions, reusable data products, practical governance, and support that does not rely on a single report developer. By fostering a strong data culture, your organization ensures that analytics remains a core pillar of decision making.
Microsoft Fabric expands this capability across engineering, storage, real-time analytics, and Power BI. With the right operating model, your business intelligence platform becomes a repeatable service that improves reporting speed, cost control, and confidence in every important number. As you refine your approach, high user adoption confirms that your investment is delivering value, while the shift toward efficient self-service BI empowers teams to act on insights faster. Ultimately, a mature Power BI Center of Excellence is not a static project, but an evolving service that continuously adapts to the changing needs of the business.
