
Microsoft Fabric connects product usage, subscription billing, and finance data so you can see which customers generate revenue and which show renewal risk. Effective SaaS revenue analytics depends on shared customer identities and consistent metric definitions, not another dashboard.
For U.S. finance and analytics teams, SaaS analytics means fewer spreadsheet reconciliations and clearer explanations of expansion, churn, and profitability. Start with the data relationships that make those explanations trustworthy.
Key Takeaways
- Connect billing customers to product tenants before calculating account-level revenue.
- Keep recurring revenue, cash collections, and recognized revenue separate.
- Use governed Power BI measures to connect customer behavior with retention and expansion.
Connect Product Usage and Billing Data in Microsoft Fabric
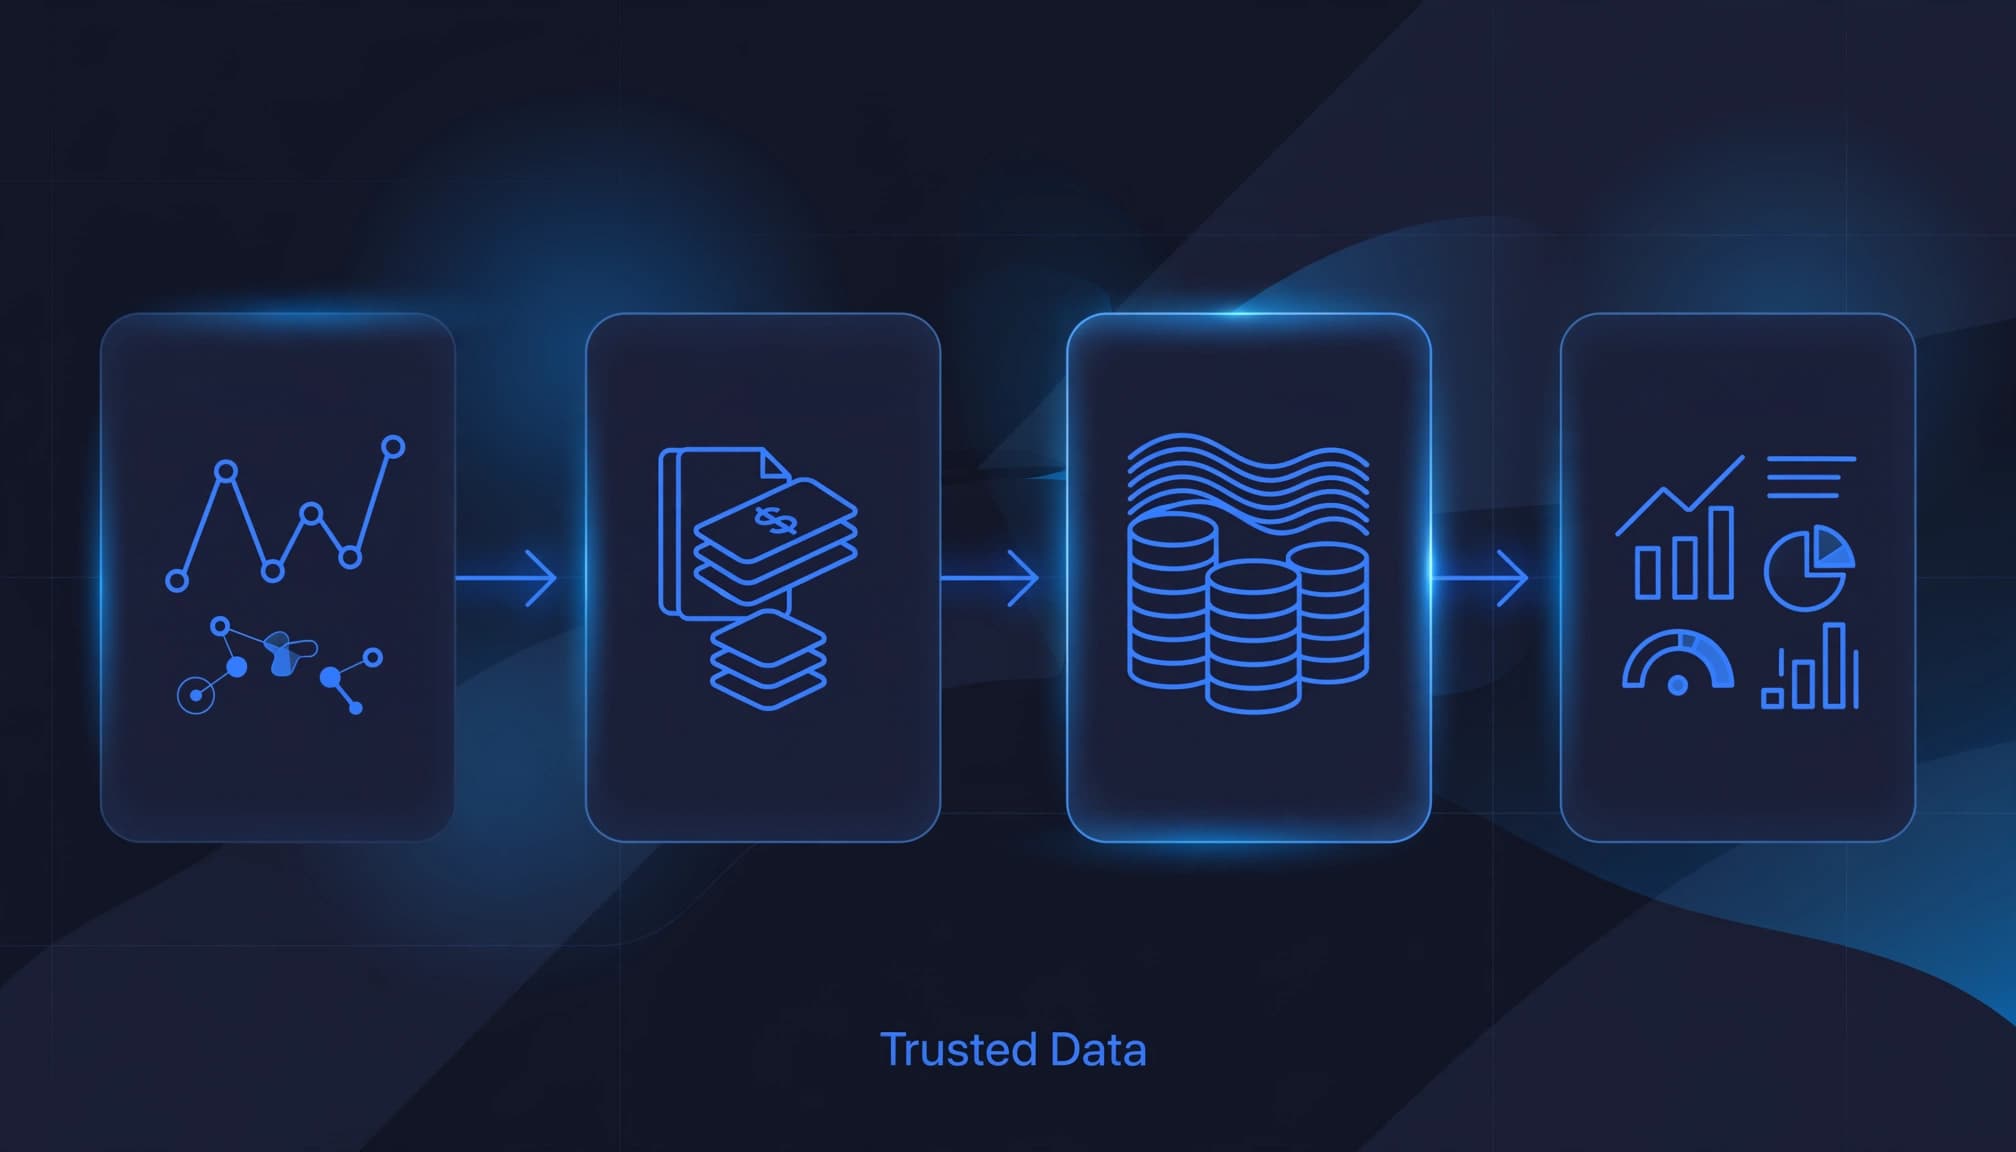
Fragmentation is common. A Market Pulse survey reported that companies draw on more than 400 data sources for analytics. Meanwhile, only 24% of respondents described their organizations as data-driven in NewVantage’s 2020 survey.
For SaaS data analytics, Fabric brings product-usage events and billing records into a shared analytical foundation. Microsoft’s Lakehouse and Warehouse architecture guide explains their complementary roles.
Ingest billing records and product events
Capture subscription changes, invoice lines, credits, payments, and service dates from a billing system such as Stripe or Recurly. Connect integrations to a monitored data pipeline, using supported connectors or API ingestion.
With Stripe, use cursor-based pagination and incremental loads to capture changes without reprocessing every record. Plan historical backfills separately.
Data Factory pipelines orchestrate ingestion. Dataflows Gen2 supports Power Query-based preparation, while notebooks handle more complex transformations.
Treat ingestion and transformation as ETL. Add data quality checks for missing IDs, duplicate events, and currency or date issues.
Retain source identifiers and ingestion timestamps in a Microsoft Fabric Lakehouse. For Stripe backfills, preserve original source IDs so historical records remain traceable. For streaming product events, Fabric Real-Time Intelligence can process activity through Eventstream and Eventhouse.
Establish the customer relationship
Create an effective-dated bridge between product tenant IDs, CRM accounts, and billing customer IDs. Account mergers and multiple subscriptions make email addresses unreliable join keys.
Keep usage events and invoice lines in separate fact tables. Otherwise, joining every event to every invoice line multiplies revenue.
Use OneLake for shared data access, then use a Microsoft Fabric Warehouse or another data warehouse for SQL-based dimensional modeling. Store customer, plan, currency, and calendar dimensions alongside those facts.
Define SaaS Revenue Analytics Metrics Once
Publish approved calculations through Fabric semantic models rather than rebuilding them in individual reports. Document treatment of discounts, credits, taxes, and one-time charges.
Separate recurring revenue from retention
MRR is the sum of customers’ recurring revenue for a month, normalized to monthly amounts. ARR equals 12 x MRR. Exclude one-time implementation fees from recurring subscription metrics.
Average revenue per account (ARPA) is revenue divided by the number of accounts. Match the denominator to the account group or cohort used in the calculation.
These calculations measure different aspects of retention.
| Metric | Formula |
|---|---|
| Net revenue retention (NRR) | (Starting MRR + expansion – contraction – churn) / starting MRR |
| Gross revenue retention (GRR) | (Starting MRR – contraction – churn) / starting MRR |
For a cohort starting at $100,000 MRR, $20,000 expansion, $5,000 contraction, and $10,000 churn produce 105% NRR and 85% GRR.
The difference matters: expansion can conceal substantial losses among existing customers.
Measure acquisition economics with consistent units
Customer acquisition cost (CAC) equals total sales and marketing spending, including associated staff salaries, divided by new customers acquired. Spending $100,000 to acquire 200 customers produces a $500 CAC.
Months to recover CAC equals CAC divided by monthly gross revenue per customer minus monthly cost of sales per customer. Use parentheses: CAC / (monthly revenue – monthly cost of sales).
Customer lifetime value can be estimated as:
CLV = (monthly customer revenue x 12 x years active) – acquisition and maintenance costs.
The factor of 12 aligns monthly revenue with years. Keep revenue, costs, and retention assumptions on the same customer or cohort basis. Use consistent recurring-revenue and retention assumptions in revenue forecasting to make forecasts comparable.
Build a Dashboard That Explains Revenue Changes
A SaaS analytics dashboard should connect financial movements to account behavior. Use dashboards to show those movements, and build the first version around one billing source and one agreed reporting period.
- Create monthly subscription snapshots with opening MRR, expansion, contraction, churn, and closing MRR.
- Track usage KPIs by account and period, including active users, purchased-seat utilization, and adoption of revenue-relevant features.
- Publish Power BI measures in dashboards with account drill-through for ad hoc analysis, cohort filters, and data-freshness timestamps.
- Validate totals against billing exports before releasing the report to finance and customer success.
Add customer health only after defining its inputs. A customer health score might total engagement, community involvement, and willingness to refer, producing nine points out of twelve. Validate whether that score predicts renewal.
For cohort analysis, compare customers with similar start dates and plans. Otherwise, differences in customer age can distort conclusions about feature adoption.
Keep Revenue Recognition Separate From Billing
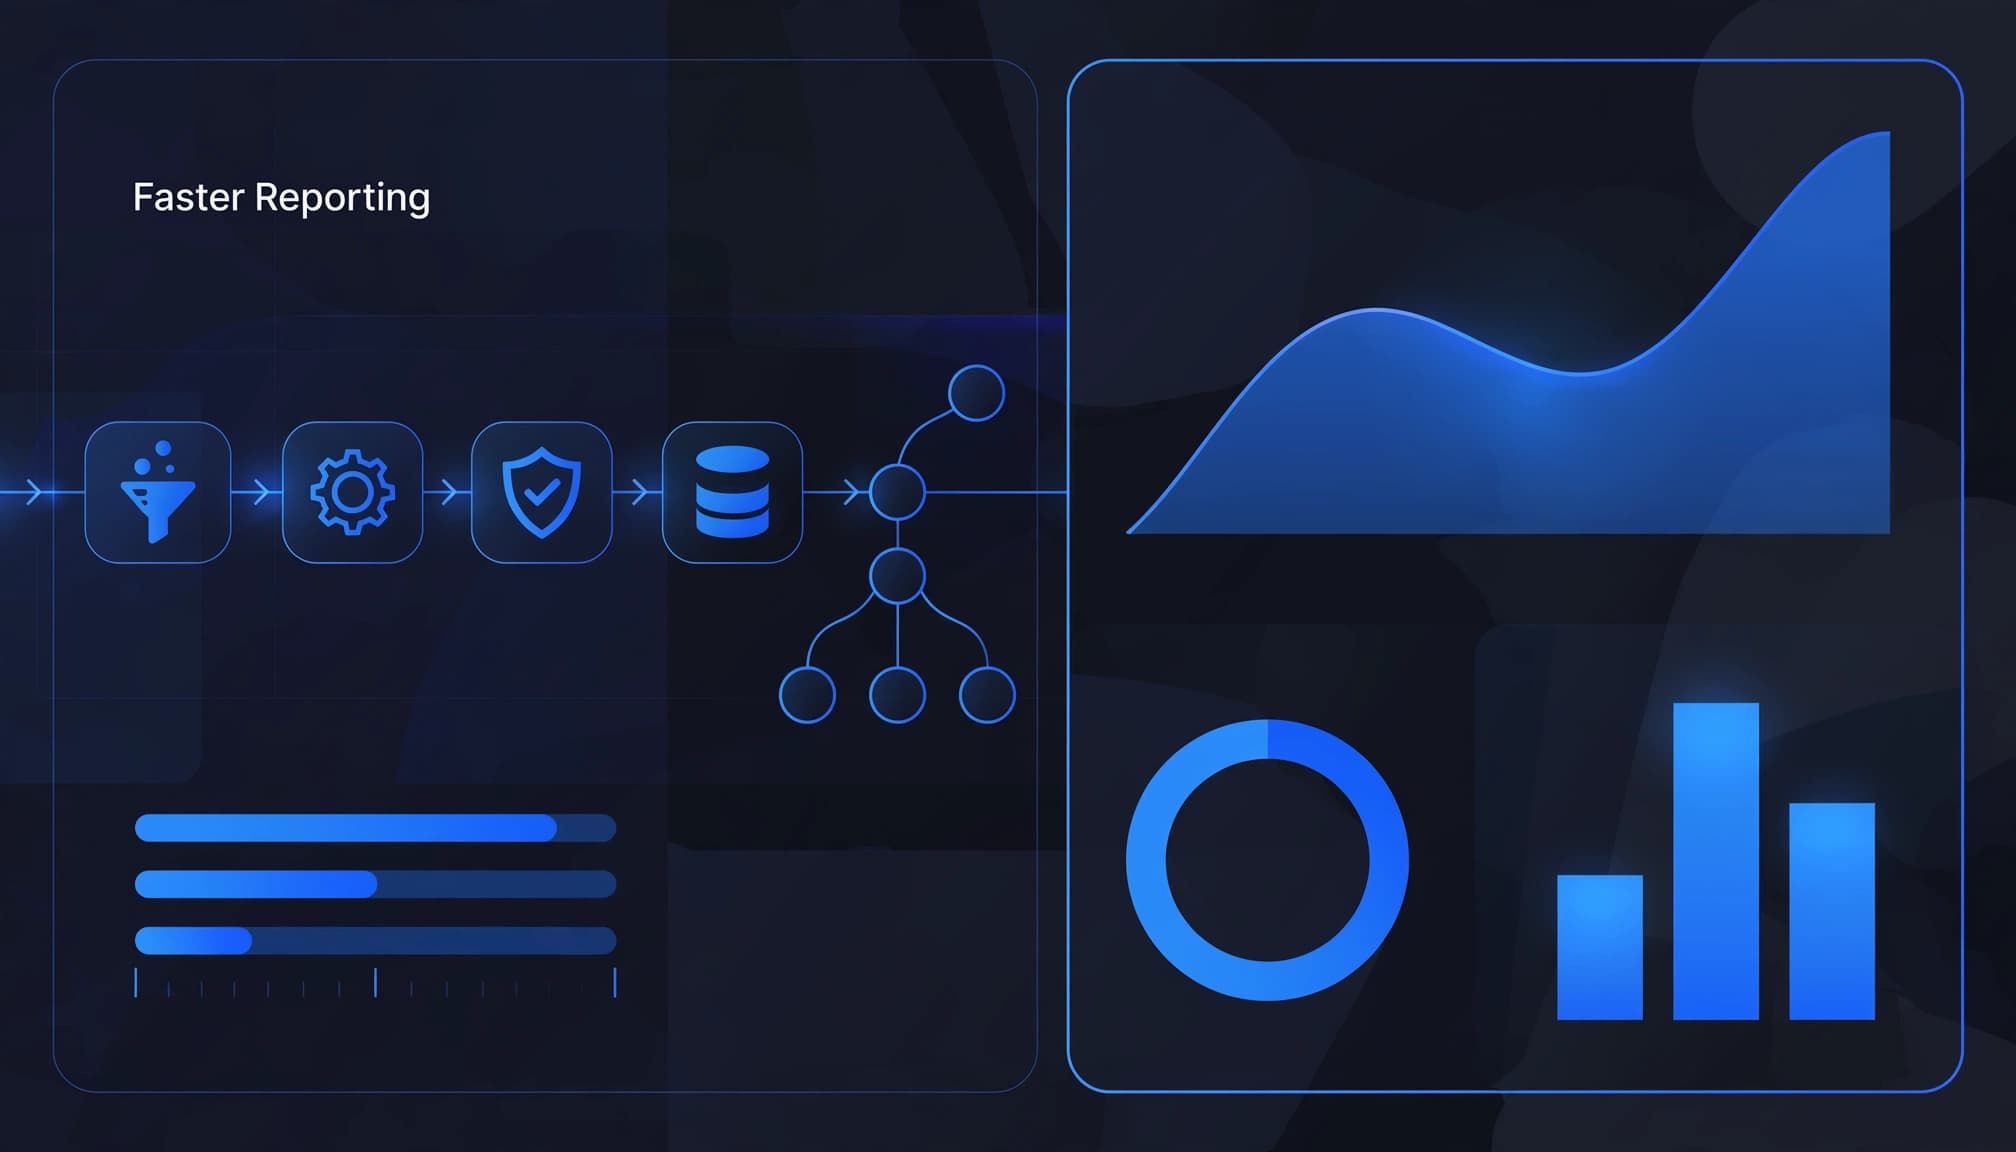
ASC 606 under U.S. GAAP and IFRS 15 under IFRS govern revenue recognition for customer contracts within their scope. Both apply a five-step model: identify the contract, identify performance obligations, determine the transaction price, allocate that price, and recognize revenue as obligations are satisfied. Keep the accounting policy and contract evidence traceable to ASC 606 and IFRS 15.
For a simple $1,200 annual subscription delivered evenly over twelve months, recognize $100 monthly. The revenue recognition schedule is separate from billing and cash collection. Each performance obligation should reflect how the contract’s services are delivered. Cash can arrive upfront, but revenue follows service delivery.
Microsoft’s guidance on revenue and expense deferrals describes support for these accounting standards.
Fabric can analyze recognition schedules, but it doesn’t automatically replace a revenue accounting subledger or revenue recognition software. Import approved schedules and journal references from the accounting system. Have accounting review ASC 606 and IFRS 15 schedules before publication.
For deferred contracts, reconcile opening deferred revenue plus deferred billings, minus recognized revenue, with adjustments for credits and foreign exchange. Validate each revenue recognition schedule against the general ledger by entity, currency, and accounting period.
MRR can remain stable while cash collections and recognized revenue change. Label all three separately in executive reporting.
Compare Fabric With Subscription Reporting Tools
Choose SaaS reporting tools based on the questions you need answered. Billing-native tools speed up subscription reporting, while Fabric connects usage, finance, CRM, and operations data.
| Option | Best fit | Pricing context |
|---|---|---|
| 1. Microsoft Fabric | Governed, cross-system analytics with Power BI | Capacity-based, with licensing and storage considerations |
| 2. Packaged subscription reporting | Standard subscription metrics and dashboards | Often tiered by annual recurring revenue or usage |
| 3. Subscription analytics platforms | Segmentation and subscription performance analysis | Often tiered by revenue, features, or billing frequency |
| 4. Subscription billing platforms | Billing workflows with built-in reporting | May combine a monthly fee with transaction charges; revenue recognition may cost extra |
| 5. Free subscription analytics | Core metrics and benchmarks | Free tiers may be bundled with other services |
Fabric’s advantage grows when revenue analysis requires product telemetry, multiple billing systems, or general-ledger reconciliation. A packaged subscription tool can still complement it.
Compare pricing, integrations, and metric definitions across categories. Check that billing sources such as Stripe connect cleanly to your analytics model. ChartMogul’s published pricing distinguishes monthly and annual Starter billing.
Weigh total operating cost against the reporting scope you need. A lower subscription fee may not cover the integrations or reporting work required.
Also separate analytics from accounting requirements. A tool that calculates churn may lack performance-obligation allocation, deferred-revenue schedules, or journal-level auditability.
Customer Success: eMabler Connects Billing and Telemetry
Microsoft’s eMabler customer story describes how the EV charging platform unified scattered operational, billing, and telemetry data in Microsoft Fabric.
The shared analytics platform supports real-time insights and advanced automation. For SaaS businesses, the relevant lesson is the connection between service consumption and commercial records.
Product usage becomes more useful when teams can interpret it alongside billing. Likewise, a revenue movement becomes easier to explain when the underlying operational activity is available.
Govern and Optimize Before Expanding
Microsoft Fabric governance requires explicit ownership, access policies, and monitoring. Built-in capabilities support these controls, but teams still need to configure them.
Protect customer data and metric definitions
Restrict sensitive billing attributes, apply appropriate access controls, and maintain lineage between sources, curated tables, and reports. Our Fabric governance guidance connects those controls to reusable analytics.
Assign finance ownership of revenue definitions and product ownership of event definitions. Broad self-service analytics should follow agreement on customer identities, metric definitions, and access policies, not precede it. Because these definitions can change, retain transformation logic and effective dates rather than overwriting history.
Plan capacity around actual workloads
Microsoft Fabric capacity planning should account for ingestion, transformations, semantic-model queries, and concurrent report usage. Schedule heavy processing so it doesn’t compete unnecessarily with executive reporting.
Power BI semantic model optimization includes removing unused columns, reviewing relationships, and reducing expensive calculations. Measure performance before increasing capacity.
Monitor pipeline failures, stale data, and reconciliation exceptions after launch. Microsoft Fabric managed services should address these operational responsibilities alongside performance optimization and cost control.
Deliver the Platform Around Business Outcomes
At Spargent Analytics, our Microsoft Fabric consulting services cover design, implementation, migration, optimization, and ongoing support for U.S. clients. Our SaaS data analytics work connects product, billing, and finance data to Power BI. We add senior capacity to internal analytics teams and support organizations without a dedicated data function.
Our data engineering services span ingestion, Fabric Data Factory, Dataflows Gen2, Lakehouse, Warehouse, and OneLake. We connect that foundation to Power BI, governed semantic models, and real-time analytics.
For a Power BI to Microsoft Fabric migration, we review existing measures and dependencies before moving reports. This reduces the risk of transferring inconsistent definitions into a larger platform.
Our delivery is built around U.S. companies, with senior Microsoft Fabric specialists based in Europe. Clear communication and an efficient cost structure support a stronger ROI case than labor-intensive, USA-only consulting models.
We measure analytics modernization through reporting turnaround, manual reconciliation effort, adoption, and platform operating costs. Those measures keep implementation decisions tied to business results.
Frequently Asked Questions
What is the SaaS revenue model?
Customers pay recurring subscription fees, usage-based charges, or both for continued software access. Revenue analytics connects those commercial terms with customer behavior, retention, acquisition costs, and profitability.
Does Power BI need replacing when moving to Fabric?
No. Power BI remains Fabric’s reporting experience. Microsoft Fabric and Power BI integration adds shared data engineering and storage capabilities behind reports. Existing models still need assessment, but migration doesn’t require rebuilding every dashboard.
Start With One Trusted Revenue View
Reliable SaaS revenue analytics connects product behavior to billing through governed customer identities and shared measures. Reconcile one reporting use case, then expand once teams trust the results. Finance, product, and customer-success teams can use the trusted view for data-driven decision making.
Book a Microsoft Fabric Discovery Call to review your data environment and identify a practical first implementation or migration scope.
