
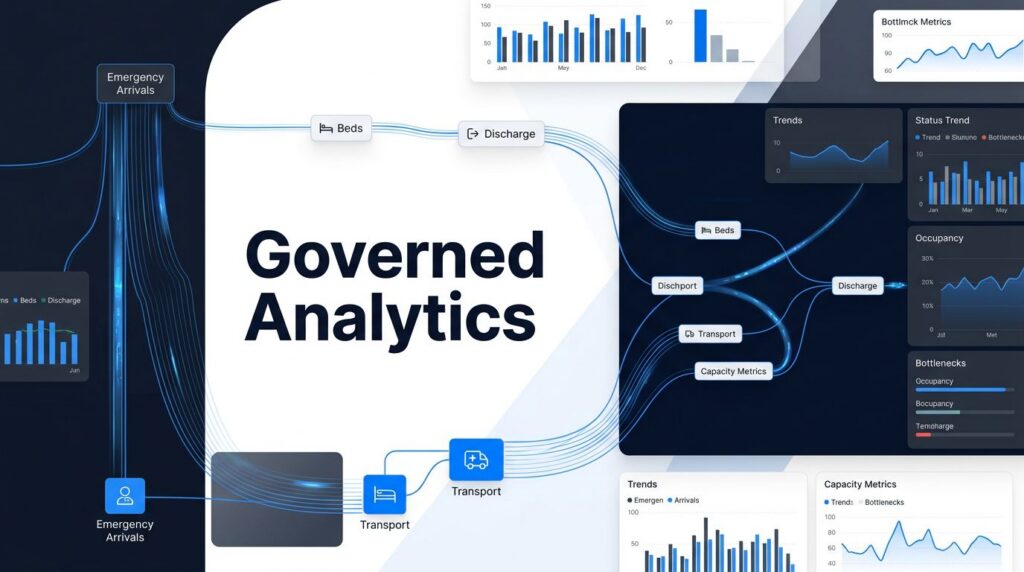
Patient flow analytics helps hospital managers find ways to improve efficiency, patient outcomes, and financial results. By providing a clear view of the entire care process, it highlights where bottlenecks occur, enabling hospitals to address delays that impact care quality, staff workload, and patient flow.
An emergency department can still be crowded even when clinical work is done if beds, clean rooms, transport, or discharge decisions are delayed. Patient flow analytics gives leaders a single view of these delays, instead of just another report on wait times.
Good decisions about patient flow depend on accurate timestamps, shared definitions, and clear responsibility. With well-governed data, all teams can work from the same understanding of demand, capacity, and patient movement.
Key Takeaways
- Patient flow analytics should include the whole hospital journey, covering arrivals, care activity, bed assignment, discharge readiness, transport, and physical movement.
- Trusted timestamps, shared metric definitions, clear data ownership, and quality checks are essential when making decisions about demand, capacity, and patient movement.
- A governed Microsoft Fabric architecture can combine operational data, semantic models, Power BI reporting, real-time signals, and predictive models while ensuring sensitive information is protected.
- Analytical tools generate operational value when each measure, alert, and forecast has a clear decision associated with it, a clearly defined accountable owner, an escalation process, and an expected completion time.
- Hospitals should start by establishing a high-pressure pathway, check the data and the workflow, and only then move on to predictive models and wider applications once the teams have come to trust the results.
Patient flow analytics needs a whole-hospital view
Patient flow includes all aspects of the patient’s journey from referral or arrival through treatment, admission, discharge, transfer, and follow-up. Although the emergency department usually shows the greatest pressure, the root cause may be inpatient discharge planning, imaging turnaround, environmental services, transport, or transfers.
Bad flow may lead to a delay in treatment and can have an adverse effect on clinical outcomes. It may increase length of stay, consume staff time, delay procedures, and create patient safety risks.
It also affects patient satisfaction and financial performance related to throughput and bed use.
Look beyond bed occupancy
High bed occupancy is just a signal, not the full story. To manage bed capacity well, look beyond just the numbers. Sometimes, beds may appear available even though patients are still waiting for placement.
A bed might be dirty, lack assigned staff, be set for the wrong patient type, or be marked unavailable in the system because of staff schedules.
Effective patient flow analytics tracks the whole process, including arrivals, care steps, handoffs, discharge readiness, and patient movement. This full view helps leaders tell the difference between a true capacity shortage and an operational issue they can fix.

Map the patient journey with timestamped events
A simple process map often does not show how patients really move through a hospital. Patient flow analytics needs detailed records of each event, including what happened, when, and which team was responsible for the next step.
Build an encounter event spine
Start with a stable encounter identifier, then link timestamps from the clinical, operational, and administrative systems. Make sure to include the times corresponding to ED arrival, triage, provider assessment, lab collection, imaging completion, admission decision, bed request, bed assignment, room cleaning being finished, transport request, inpatient arrival, discharge order, discharge readiness, and actual departure.
The event spine can provide time-bounded features for use with machine learning and predictive models. These features assist with forecasting and allow retrospective analysis of the event log to explain completed journeys.
Each event should record its source system, type, update time, and data quality. This lets the data science team check event definitions and review the event paths. It also helps tell if a delay was due to a late action or a late data feed, and prevents corrected timestamps from quietly replacing the original record.
Use process mining to expose real bottlenecks
Process mining is able to reconstruct the real paths that patients take in an emergency department using the event logs. It can identify a bottleneck, repeated handoffs, unnecessary loops, long waiting times between disposition and bed assignment, and patient groups who follow different paths even though their needs are similar. When combined with queueing theory, the approach demonstrates how queue age and cause influence operational decisions.
A 2024 study comparing process mining and simulation in emergency departments showed that these methods can reveal where delays build up before leaders make costly changes to staffing or bed capacity. The goal is not just a better-looking diagram, but a clear explanation of where time is lost.
A queue should be measured by its age and cause, not only by the number of people in it.
Govern the data before publishing dashboards
A dashboard that looks good can quickly cause confusion if teams do not agree on basic definitions. Good governance turns hospital data into a reliable tool for decision-making.
Define the terms that drive action
Teams should agree on key terms before building models. For example, ‘available bed’ might mean empty to one group, cleaned to another, and ready with staff to a third. The command center’s definition must match the actions leaders plan to take.
Assign each high-value metric to a business owner, who then approves the calculation method, inclusion rules, exclusions, and escalation thresholds. Document these decisions in a glossary that report authors and the data science team can see, thus avoiding multiple definitions of boarding time or length of stay.
Protect sensitive data at ingestion
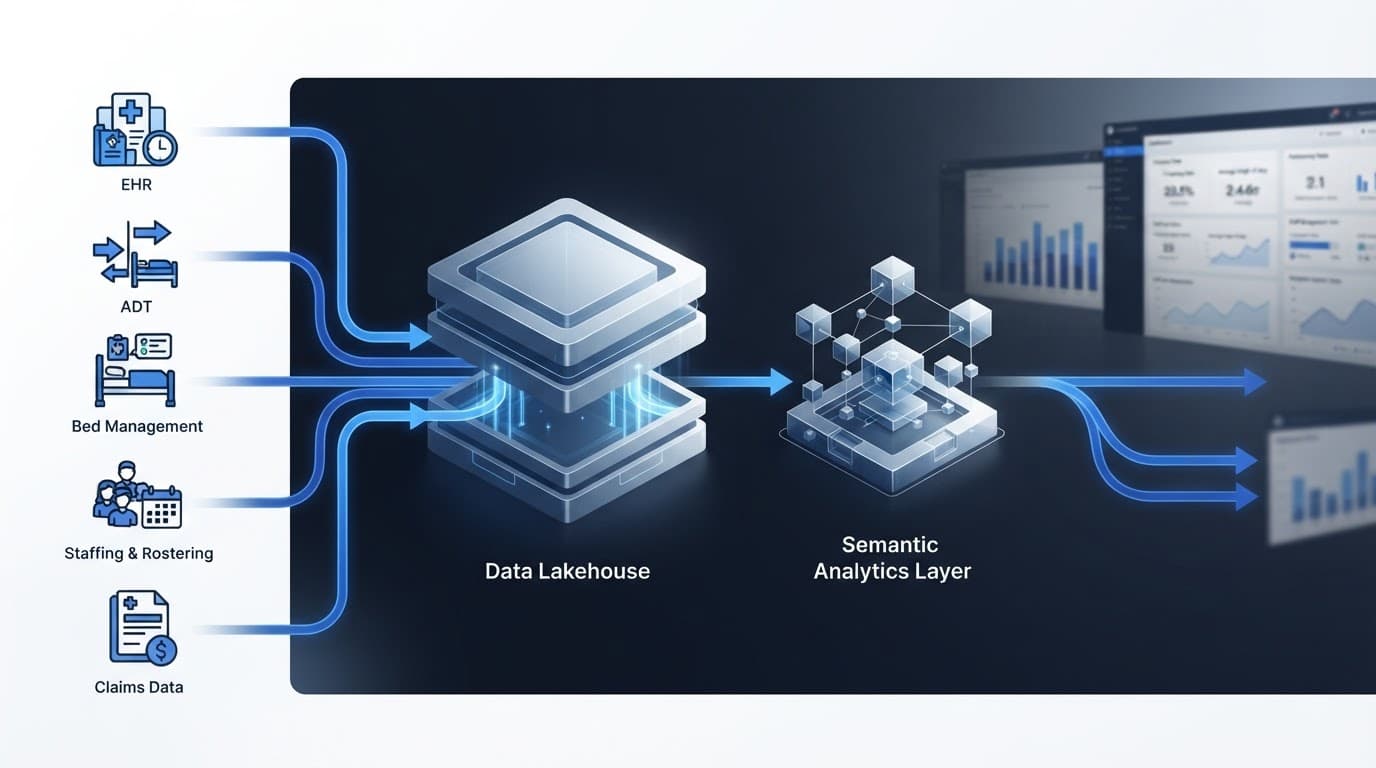
Patient Flow analytics usually combines feeds from ADT systems, electronic health records (EHR), scheduling systems, claims, staffing, transport, and bed-management systems. Each of these sources has its own privacy and access requirements.
A good governance plan for Microsoft Fabric should include data minimization, role-based access, sensitivity labels, and audit controls as early as possible. Even when using protected datasets for machine learning, training data, access, and validation rules must follow governance standards. When bringing in data, direct identifiers can be tokenized or anonymized so users only see the personal information needed for their roles.
Federated governance suits large, complex healthcare organizations because a central team sets definitions, access controls, certification rules, and retention requirements, while clinical and operational domains remain responsible for the quality of their own data and processes.
Build a governed Microsoft Fabric architecture
Microsoft Fabric brings together operational and historical hospital data in a single, governed analytics environment. It connects easily with common EHR systems like Epic and Cerner, and supports HL7, FHIR, and flat file interfaces. Data pipelines can securely and gradually extract data, reducing disruption and the need for custom integration. Fabric supports patient flow analytics and other solutions without requiring every team to use copied data extracts.
Microsoft’s healthcare data solutions overview describes support for ingesting, storing, and analyzing healthcare data from sources such as EHR and imaging systems.
Ingest data with clear engineering controls
Microsoft Fabric data engineering services must establish repeatable ingestion patterns for each source. Every data pipeline should include source-to-target mappings, incremental-load rules, failure alerts, reconciliation checks, and lineage records. Fabric Data Factory consulting helps hospitals standardize pipelines across on-premises systems, Azure services, and vendor-managed applications.
A Dataflows Gen2 implementation enables visual and reusable transformations for suitable business data.
Microsoft’s Dataflows Gen2 guidance describes how this capability enables multi-step ingestion and transformation via Power Query Online. However, high-volume ADT, scheduling, or telemetry feeds still require engineering standards regarding latency, retries, and data validation.
Separate raw, curated, and reporting layers
A Microsoft Fabric Lakehouse can store both raw and processed event data for data engineering teams, feature preparation, and machine learning. Curated event data can support approved predictive models, with a data science team accessing it under established governance controls. The Microsoft Fabric Warehouse can, in turn, offer governed relational marts for SQL-based operational reporting and finance-ready analysis.
OneLake consulting assists teams in determining where their existing data should remain, where it is appropriate to take shortcuts, and where a managed copy is required. Its strong integration with Microsoft Fabric Power BI then enables operational users to access certified measures without having to rebuild the logic in spreadsheets or individual reports.
Treat semantic models as operational contracts
Patient flow reports often fail because each dashboard uses slightly different calculations. A governed semantic layer makes analytics consistent, giving clinical, operational, and finance teams a shared foundation for discussion.
Publish certified measures, not disconnected reports
Fabric semantic models should define their measures once and make them available in all approved Power BI reports. Optimized semantic models also reduce duplicate tables, unnecessary calculations, and slow queries, which can make a dashboard unusable during a bed huddle. After approval and validation, the data science team can reuse the certified measures for machine learning features and predictive models.
The following measures give leaders a practical baseline for monitoring operational performance:
| Measure | Calculation | Operational decision |
|---|---|---|
| Door-to-provider time | Initial provider assessment minus arrival | Adjust intake, triage, or provider coverage |
| ED boarding time | Inpatient departure minus admission decision | Escalate discharge, bed, or transport constraints |
| Bed turnaround time | Bed-ready time minus patient out-time | Improve cleaning and room-release coordination |
| Discharge-ready delay | Actual departure minus discharge-ready time | Identify pharmacy, transport, and paperwork delays |
| Left without being seen rate | Eligible patients leaving before assessment | Review wait conditions and intake capacity |
To show resource use, break down each measure by acuity, care setting, time, service line, and destination. Hospitals should also show how current the data is and when it was last refreshed. A report that looks current can be risky if the data is actually two hours behind real operations.

Match real-time analytics to the decision window
Real-time data is only useful if you can act while the information matters. Trends like length of stay help with planning, but a late alert about boarding might need action within minutes.
Use live signals for operational coordination
By using Fabric Real-Time Intelligence, event streams can be combined with historical context in order to provide near-real-time patient flow analytics. Eventstream, Eventhouse, real-time dashboards, and controlled alerts can monitor bed status, pending discharges, inbound transfers, transport delays, and demand surges. These tools help teams identify exceptions before they become widespread crowding.
Alerts should trigger a set human workflow. For example, if a bed is delayed, the right operations staff should be notified, but clinical placement decisions should not be changed automatically.
Here, Microsoft Fabric performance optimization and Microsoft Fabric capacity planning are important. Monitor pipeline duration, query response time, refresh reliability, concurrent users, and workload peaks. When making capacity decisions, consider observed workload patterns, including staff scheduling requirements, and provide sufficient buffer for urgent operational reporting.
Validate predictive models before using them
Machine learning can forecast likely admissions, pending discharges, expected inpatient duration, future bed demand, and readmissions. However, each prediction must use only data available at the time of the decision. Otherwise, the model may look accurate in testing but fail in daily operations.
The ED study on hospitalization and waiting-time prediction focuses on emergency department operations and highlights how timely data can improve operational efficiency and help manage wait times. A machine learning validation workflow should compare predictive models with a simple baseline, test them on later data, and review calibration. The data science team should monitor drift while clinicians and operations leaders remain in control of decisions.
Give the patient flow center clear decision rights
A central operations center can connect the emergency department, inpatient units, surgery, environmental services, transport, and transfer teams. But if it lacks clear decision-making power, it just becomes another place to observe problems without solving them.
Run short, repeatable operating loops
For the Patient flow center, it is necessary to agree on a cadence when reviewing the current census, the number of hospital beds available, admissions waiting for beds, the barriers encountered in the discharge process, staffing constraints, transfer requests, and the high-risk queues. Every issue should have a designated owner, a clear procedure for escalation, a specific action, and an expected time for completion.
At this stage, patient flow analytics becomes part of daily operations. Managers need to know the current situation and get short-term forecasts from predictive models. The data science team can manage and explain the models, so managers can ask about wait times for certain groups without exposing extra clinical details.
Microsoft’s Virtua Health customer story describes Power BI dashboards and Copilot summaries that support at-a-glance patient information within a broader Microsoft Fabric and Azure data layer. The same idea applies to flow operations: reliable context should be made available promptly and responsibility should be assigned to the team that is able to take action. The aim should be to support decision-making, not to automate clinical placements.

Deliver patient flow analytics in practical stages
Trying to address all patient pathways at once often delays results and slows workflow improvements. Instead, start with a high-pressure pathway, such as ED-to-inpatient admission, surgical discharge, behavioral health placement, or outpatient infusion scheduling.
Build the first release around a decision
- For each analytics solution, specify the operational decision, name the person who is accountable for it, and state the measure that will demonstrate improvement.
- Adjust the required source events and produce a governed event timeline together with data-quality checks.
- Make available one certified semantic model and a focused Power BI report for the operating team.
- Only after the team have come to trust the results should the workflow be run, the exceptions be reviewed, the forecasts be back-tested and the predictive models be expanded.
Hospitals planning to modernize their data platforms can reduce manual Excel reporting by following this sequence. It also builds a stronger foundation for analytics and future machine learning projects.
Add senior delivery capacity without building a large team
Spargent Analytics offers consulting services related to Microsoft Fabric to various healthcare organizations in the United States that require senior delivery resources for either a data science team or a full specialist team. Since each health system has its own systems, workflows and governance responsibilities, the company’s Microsoft Fabric consultants provide support with regard to ingestion, Data Factory pipelines, Lakehouse and Warehouse design, OneLake, Power BI, Fabric semantic models, governance, real-time reporting, and managed support.
A Microsoft Fabric implementation partner should also make arrangements for Microsoft Fabric migration work before transferring the reports. This involves determining how to migrate to Microsoft Fabric, establishing a migration route from Power BI to Microsoft Fabric, validating the data lineage, carrying out security reviews, and providing adoption support. After going-live, Spargent offers Microsoft Fabric analytics consulting, Microsoft Fabric governance support, and Microsoft Fabric managed services.
Spargent delivers services tailored to U.S. organizations, using senior Microsoft Fabric specialists based in Europe. This setup combines strong communication, skilled engineers, and a cost-effective model that offers better value than U.S.-only consulting. U.S. clients can book a Microsoft Fabric Discovery Call to review their current setup, delivery gaps, and migration needs.
Success Story: Healthcare Data Modernization with Microsoft Fabric
The large healthcare organization worked with Spargent Analytics to update its data environment using Microsoft Fabric, and the project succeeded in bringing about a more unified setup for data ingestion, analytics, governance, and reporting across many hospitals and operational systems.
Spargent’s team set up a governed data foundation aimed at reducing fragmented data workflows, improving access to reliable information, and enabling analytics on a large scale. The integration of data engineering, governance, and reporting within Microsoft Fabric allowed healthcare teams to obtain a more consistent base for operational insights and advanced analytics.
The modernization led to real improvements: manual data entry dropped by 40 percent, report delivery time fell from 24 hours to under 2 hours, and analytical workflow efficiency rose by 35 percent. These results let teams access information faster and allowed staff to focus on more valuable work.
All healthcare organizations have different systems, workflows, and regulatory requirements, and the experience shows that successful adoption of Fabric depends on more than just the implementation of technology since it also requires a combination of data architecture, engineering, governance, and business adoption.
Now that the foundation has been established, the organization can go on to optimize both the performance and cost of Fabric by keeping an eye on capacity utilization, semantic model efficiency, refresh patterns, and continued support needs.
Spargent Analytics assists healthcare organizations in modernizing their fragmented data environments using Microsoft Fabric and in establishing scalable bases for analytics and AI
Frequently Asked Questions
What is patient flow analytics?
Patient flow analytics makes use of connected data to illustrate the way in which patients move around a hospital and where time is accumulated. By combining information about timestamps, the operational context, and performance measures, it helps teams to identify and deal with delays.
Why does patient flow analytics require governed data?
Data that is governed provides the clinical, operational, and finance teams with common definitions, reliable timestamps, and clear responsibility for key measures. It also includes suitable access controls, data quality checks, lineage, and the protection of sensitive patient information.
Which measures should hospitals track first?
A set that is suitable to start with should include door-to-provider time, ED boarding time, bed turnaround time, discharge-ready delay, and the left-without-being-seen rate; hospitals must break down these measures by factors such as acuity, care setting, service line, time, and destination.
How can Microsoft Fabric support patient flow analytics?
Microsoft Fabric is able to connect data from EHR systems, ADT systems, scheduling, staffing, transport, and bed management within a governed Lakehouse, Warehouse, semantic model, and real-time analytics environment. This setup enables certified Power BI reporting, operational alerts, and validated predictive models without the need for disconnected extracts.
How should a hospital begin implementing patient flow analytics?
Start with one high-pressure pathway and define the operational decision, accountable owner, and success measure. Then reconcile source events, publish a certified semantic model and focused report, validate the workflow, and expand only after the operating team trusts the results.
Make governed flow data part of daily hospital operations
Patients experience delayed flow as lost time, uncertainty, and repeated handoffs. Hospital teams see those same delays as fragmented timestamps, competing definitions, and operational queues.
Patient flow analytics works when governed data reveals the true constraint and gives the right team a clear action. A reliable event foundation, trusted metrics, timely alerts, and accountable routines turn reporting into better decisions and clinical outcomes..
