
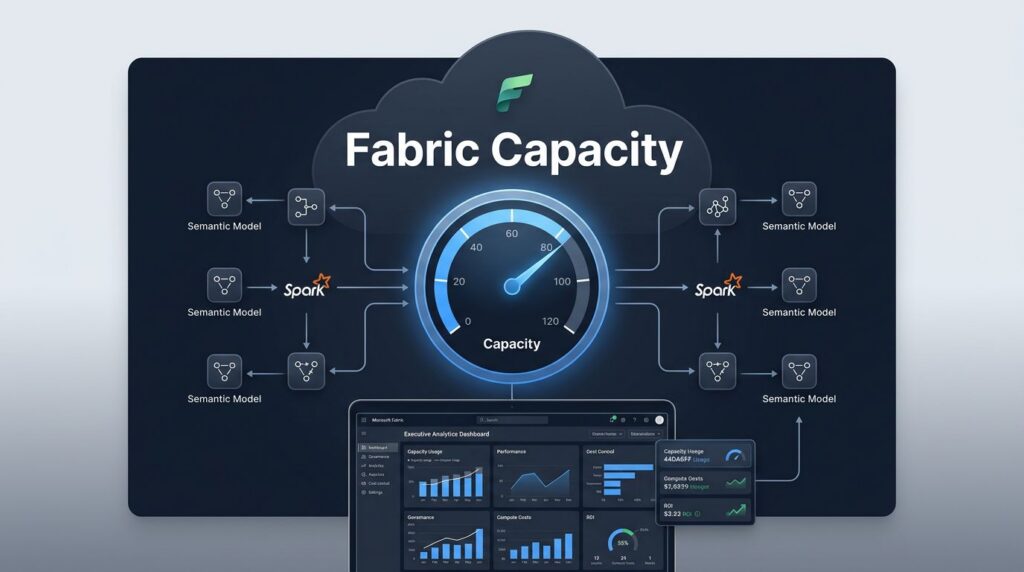
Microsoft Fabric capacity can become expensive long before it becomes visibly slow. A few unplanned refreshes, large semantic models, Spark jobs, or AI workloads can consume shared Capacity Units while finance only sees a growing Azure bill.
Effective Fabric capacity management connects platform performance with cost accountability. It gives data leaders enough visibility to protect executive reporting, control spend, and scale Microsoft Fabric when real demand justifies it.
The practical starting point is simple: measure demand, remove waste, isolate critical workloads, and scale with evidence.
Key Takeaways
- Microsoft Fabric compute functions as a shared pool of Capacity Units, meaning one inefficient workload can negatively impact the performance of Power BI reports, data pipelines, notebooks, and real-time analytics.
- Use the Capacity Metrics App to thoroughly review CU consumption, throttling, interactive delays, and background processing before you decide to upgrade your Fabric SKUs.
- Prioritize optimizing your data models, refresh patterns, pipelines, and queries to maximize efficiency before buying more compute capacity.
- Separate development, testing, and production workloads to ensure that experimental processes do not disrupt critical business reporting.
- Drive organizational efficiency by making cost ownership visible through showback reporting, standardized workspace naming, and regular capacity reviews.
Start With Fabric’s Shared Capacity Model
Microsoft Fabric utilizes a shared capacity model. Rather than purchasing separate compute resources for Power BI, data engineering, warehousing, and real-time analysis, organizations buy Fabric SKUs that provide a pool of Capacity Units. This unified approach supports diverse workloads across the entire platform.
This model can reduce software sprawl. However, it also creates a shared-resource problem. A poorly timed full refresh can compete with an executive dashboard. A large notebook job can affect an interactive Direct Lake report. An ungoverned workspace can consume capacity without a clear business owner.
Effective FinOps and governance start by treating Capacity Units as a managed business resource. Capacity owners need to know who consumes them, when demand peaks, and what outcome each workload supports. Cost reduction without service context creates frustration. Capacity growth without evidence creates waste.
The most useful Fabric cost model has two components:
| Cost Area | What to Manage | Common Risk |
|---|---|---|
| Compute capacity | CU consumption across all Fabric workloads | Paying for unused headroom or constant throttling |
| OneLake storage | Data volumes, duplicated files, retention practices | Storing unnecessary copies and outdated data |
OneLake storage can reduce unnecessary duplication because Fabric workloads share a common data foundation. Shortcuts can also provide virtual access to supported external storage rather than moving another copy into a new lake. Still, storage discipline matters. Retention policies, raw-file ownership, and duplicate extracts should have named owners.
Capacity planning should also distinguish between fixed and variable demand. A finance close, morning report refresh window, plant shift change, or retail promotion can create predictable peaks. Those peaks deserve attention, but they should not automatically set the size of a 24-hour capacity.
A useful Fabric cloud cost management guide recommends using several weeks of observed utilization before right-sizing. That approach is more reliable than sizing around a single busy day or purchasing a larger SKU just in case.
Capacity is not a license shelf. It is a shared operational resource that needs ownership, service expectations, and regular review.
Give FinOps Clear Owners and Rules
FinOps fails when capacity ownership sits between IT, finance, and business teams. Finance receives invoices but cannot explain demand. Data teams know the workloads but lack cost authority. Business users create reports without understanding shared capacity limits.
Assign capacity admins for each production capacity. These individuals do not need to build every report or pipeline. They do need authority to review consumption, manage settings in the Admin portal, coordinate incidents, and escalate investment decisions.
For most mid-market companies, a practical operating model includes a small group:
- A capacity owner who tracks spend, reliability, and utilization.
- A data engineering lead who manages pipeline, notebook, Lakehouse, and Warehouse demand.
- A Power BI owner who sets standards for reports and semantic models.
- A finance partner who validates budgets, showback, and reservation decisions.
- Business owners who approve workload priority and report service expectations.
Create naming standards for workspace assignment that show the domain, environment, and owner. A name such as FIN-PROD-CloseReporting is more useful than Workspace 14. Tags, ownership records, and documentation make showback possible when usage rises.
Microsoft Fabric governance also needs clear admission rules. Every production workspace should have an accountable owner, a stated purpose, a data classification, and a support path. New workloads should enter development or test capacity before production.
Spargent Analytics helps clients formalize these controls without burying teams in policy documents. For U.S. organizations, senior European engineers provide USA-market-ready delivery, direct communication, and an efficient cost structure that often produces stronger ROI than a traditional USA-only staffing model.

Measure Capacity Before You Change the SKU
The Fabric Capacity Metrics App should be your primary operational source of truth for tracking compute usage. This tool brings essential telemetry into a reporting experience that allows administrators to monitor consumption across all Fabric workloads.
Review the Capacity Metrics App weekly during the initial adoption phase and shift to a monthly cadence once the platform is stable. During periods of high growth, check your usage patterns more frequently. It is important to look beyond total utilization, as capacity can appear healthy on average while users experience poor performance during short, critical time windows.
Track these signals together:
| Signal | What It Indicates | First Response |
|---|---|---|
| High CU usage over time | Capacity may need optimization or growth | Identify the top-consuming items |
| Throttling events | Workloads are competing for shared compute | Inspect timing and workload design |
| Slow interactive operations | Report users may be affected | Protect interactive demand and tune models |
| Long background jobs | Processing tasks are consuming capacity | Stagger schedules and use incremental processing |
| Sudden usage spikes | A new workload or behavior changed demand | Review workspace activity and ownership |
Set internal thresholds based on your specific service expectations. Many teams treat sustained usage above 80 percent as a signal to investigate. Consistent utilization below 30 percent can justify a lower tier if no expansion is planned. Since Fabric SKUs lack a native Autoscale feature, you must actively manage capacity and right-size your environment to avoid unnecessary costs. These thresholds are operating guardrails, not universal rules.
Allow headroom for known peaks. A 25 percent to 50 percent buffer may be reasonable when workloads have predictable busy periods. However, a large permanent buffer is not a substitute for proper workload design.
Use a trial capacity or a smaller F SKU to establish a realistic baseline when possible. While Microsoft guidance for planning Fabric capacity can support early decisions, production telemetry should always drive your final sizing of Fabric SKUs.
Capacity metrics should feed into a short monthly review. Compare consumption with active workspaces, business events, incidents, and planned releases. This process turns capacity from a reactive billing issue into a managed service.
Optimize Workloads Before Buying More Compute
Buying a larger SKU can solve a real demand problem, but it cannot fix inefficient DAX, wasteful refresh schedules, oversized Power Query transformations, or uncontrolled experimentation. Microsoft Fabric performance optimization starts with the workload causing pressure. By managing compute resources effectively, you prevent the unnecessary costs associated with constant scaling.
Improve Power BI reports and semantic models
Power BI commonly drives the most visible capacity complaints because business users notice slow reports immediately. Much like the transition from the legacy Power BI Premium architecture, users today must understand how bursting and smoothing impact their experience. When reports have too many visuals, heavy cross-filtering, or expensive measures, they consume far more capacity than intended.
Start with report design. Remove visuals that do not support a decision and limit unnecessary interactions. Avoid placing multiple complex visuals on a single page, and use Performance Analyzer to identify slow queries.
Next, focus on data modeling. Semantic models work best with clean star schemas, sensible relationships, and measures that avoid expensive row-by-row logic. Remove unused columns and reduce high-cardinality fields where possible. While these semantic models often mirror the logic used in previous Power BI Premium deployments, Fabric allows for more flexible storage modes. Aggregation tables, incremental refresh, and optimized DAX are essential. Direct Lake can provide strong performance when the underlying OneLake data and model design are appropriate.
A Microsoft Fabric Power BI integration strategy should connect governed Lakehouse or Warehouse data to reports without creating uncontrolled departmental copies. This reduces manual Excel exports, fragmented reporting workflows, and conflicting versions of key metrics.
Reduce pipeline and engineering demand
Dataflows, pipelines, notebooks, and warehouses can cause background pressure that users only notice later. Full reloads are a common source of avoidable capacity unit consumption. Incremental loading should be the standard for large tables with a reliable change key or time field.
Fabric Data Factory consulting can help teams replace fragile, schedule-heavy ETL patterns with clear pipeline ownership and better orchestration. A disciplined Dataflows Gen2 implementation also improves visibility because transformations, destinations, and refresh behavior are easier to govern.
Review Power Query logic before it reaches production. Query folding matters because it pushes eligible transformations back to the source. Unnecessary sorts, merges, and repeated transformations can raise refresh duration and capacity use.
For a Microsoft Fabric Lakehouse, maintain clear Bronze, Silver, and Gold data layers where they fit the workload. Avoid copying the same cleansed dataset into multiple workspaces without a reason. For a Microsoft Fabric Warehouse, review SQL patterns, load windows, and downstream reporting demand together.
Organizations seeking Fabric cost optimization strategies should treat every recurring workload as a cost optimization decision. Frequency, volume, model design, and business value all matter when building a sustainable data environment.
Separate Workloads That Should Not Compete
A single capacity may work during early adoption, but achieving long-term performance isolation requires a more structured approach. Mixing production reporting, engineering development, proof-of-concept notebooks, and real-time workloads creates unnecessary risk as Fabric use expands.
At a minimum, you must separate development, test, and production environments. Developers need room to test new data pipelines, models, and notebooks without causing resource contention that impacts production users. Reliable report response times and consistent refresh windows are critical for business users, and combining these competing workloads often leads to avoidable performance incidents.
Further isolation makes sense when workload patterns differ sharply. A high priority Power BI reporting capacity may need protection from heavy engineering or data science jobs. Similarly, a team operating Fabric Real-Time Intelligence might require separate policies because streaming events and alerting have different timing needs than nightly reporting.
Use workspace assignment and tenant settings within the Admin portal to reflect your business priorities:
- Put executive reporting and critical operational dashboards on protected production capacity.
- Keep data engineering experimentation and new feature testing away from business-facing workloads.
- Isolate departments or programs when showback requires clear accountability.
- Schedule heavy refreshes and transformations outside known interactive reporting periods.
Capacity settings can also help protect interactive demand from background processing. However, settings do not replace good scheduling and model design. Teams still need to understand how a full refresh, notebook run, or AI workload affects everyone sharing the pool.
When a new workload causes pressure, move it into a test environment first. Measure it under representative data volumes and concurrency. Then, decide whether optimization, scheduling, or a separate capacity assignment is the right answer.
Turn Usage Data Into Financial Accountability
FinOps needs a business conversation, not an invoice review after the fact. Showback is often the best first step. It gives departments visibility into their Fabric usage even if finance does not allocate charges directly.
Map capacity usage to workspaces, domains, departments, and business services. Effective workspace assignment allows you to track resource consumption against specific business units. A sales analytics workspace, for example, should have a named owner and a defined reporting purpose. The same rule applies to operations, finance, HR, or product teams.
The Fabric Chargeback app can support this visibility. Pair it with a monthly discussion about demand changes, project launches, expensive refreshes, and retiring workloads. This keeps teams focused on useful consumption rather than raw CU totals. You should also manage tenant settings to ensure that features that impact costs are controlled and configured in accordance with your organization’s financial policies.
For continuous production needs, compare pay-as-you-go pricing with one-year reserved pricing. Pay-as-you-go offers flexibility during migration and uncertain growth. Reserved pricing can lower costs when capacity usage is stable and long-term. Revisit that decision as adoption changes.
Pause non-production capacity when teams do not need it. Development and training environments often have predictable idle periods. Automated schedules can prevent silent spend outside working hours, although teams should confirm dependencies before pausing capacity.
Microsoft’s FinOps Toolkit updates show how FinOps reporting continues to expand across Azure services. Fabric owners should integrate capacity data into the same financial reporting process rather than treating it as a separate technical expense.
Get Expert Support Without Building a Large Internal Team
Many companies have capable analysts and engineers but lack enough senior capacity for platform design, governance, cost control, and delivery. Others need to modernize quickly before they can hire a full internal data team.
Spargent Analytics provides Microsoft Fabric consulting services for U.S. mid-market and enterprise teams that need practical support across the full data lifecycle. Engagements often begin with thorough capacity planning, followed by ongoing Microsoft Fabric governance and comprehensive Microsoft Fabric managed services after go-live.
A Microsoft Fabric implementation partner can also reduce risk during a Microsoft Fabric migration. Whether you need to migrate to Microsoft Fabric from legacy SQL Server reporting, Azure services, spreadsheets, or another analytics platform, the work should start with a deep workload assessment and a clear understanding of business priorities.
Spargent’s Microsoft Fabric consultants support Power BI to Microsoft Fabric migration, Microsoft Fabric data engineering services, OneLake consulting, Microsoft Fabric analytics consulting, and analytics modernization programs. Teams also engage a Microsoft Fabric expert for Fabric Real-Time Intelligence, Fabric Data Factory consulting, Lakehouse architecture, Warehouse design, semantic model performance, and Fabric capacity management.
For U.S. buyers, Spargent offers Microsoft Fabric consulting USA with senior consultants based in Europe. The delivery model supports U.S. business needs with experienced specialists, strong communication, and a cost structure that helps clients invest more in outcomes than billable overhead.
If capacity pressure, slow reporting, or uncertain spend is holding back data platform modernization, Book a Microsoft Fabric Discovery Call to review the current environment and define the next practical step. Teams that already have a foundation can also Optimize Fabric Performance and Cost through targeted workload reviews and ongoing support.
Build Capacity Discipline Into Daily Operations
Fabric capacity management works when it becomes part of your regular platform operations. Success requires monitoring demand, assigning clear ownership, improving inefficient workloads, and making scaling decisions based on hard evidence.
To maintain effective governance, teams should leverage the Capacity Metrics App to track usage patterns and identify bottlenecks before they impact end-user performance. The strongest FinOps programs protect reporting speed while keeping costs visible to the people who create the demand. Capacity discipline turns your investment into faster insights, governed data, and a platform that can scale predictably, ensuring that Fabric capacity management remains a sustainable practice for your organization.
Frequently Asked Questions
Why is my Fabric capacity bill increasing even when my data volume seems stable?
Fabric capacity is consumed by compute intensity, not just data size. Inefficient semantic models, poorly optimized Spark jobs, and frequent refreshes can drive up Capacity Unit (CU) consumption, leading to higher costs. It is essential to review the Capacity Metrics App to identify which specific workloads are driving these spikes.
What is the most effective way to prevent slow report performance during busy periods?
To ensure consistent performance for executive dashboards, isolate production workloads from development or testing tasks. You should also stagger heavy background refreshes and notebook executions to avoid competing for the same Capacity Units. When necessary, use admission rules to prioritize interactive report queries over long-running background processes.
Should I upgrade my Fabric SKU as soon as I see high utilization?
Upgrading should be a last resort, not a first response. Before scaling up, you should audit your existing data models and pipeline schedules for inefficiencies like redundant data processing or complex DAX. Only when you have evidence that your workloads are already optimized and still require more headroom should you consider moving to a larger SKU.
How can I make departments more accountable for their Fabric capacity spend?
Implement a showback reporting process that maps capacity usage to specific workspaces, departments, and owners. By assigning clear accountability and holding regular reviews of consumption patterns, you can discourage wasteful experimentation and ensure that capacity is treated as a shared, finite business resource.
