

Most manufacturers have plenty of data, but supplier updates, inventory counts, shipment status, and production output are often kept in different systems.
When systems do not work together, teams often react too late. This can lead to missed shipments, unexpected shortages, higher freight costs, and production delays.
Supply chain visibility is not about monitoring more dashboards; it is about enabling faster, informed decisions.
A unified data foundation solves this problem. Connecting separate systems helps manufacturers cut production delays, avoid extra manual work, and lower emergency freight costs. With better visibility, teams make decisions faster, manage inventory more closely, and reduce costs and risks. For many companies, these changes mean real savings and better service each year.
What supply chain visibility really means for manufacturers
Ideally, supply chain visibility means having one reliable view of supplier commitments, available inventory, items in transit, and future production needs.
In reality, most manufacturers struggle with this. Teams in procurement, warehouse, production, and finance often use different systems and reports, which leads to inconsistent information between departments.
From separate spreadsheets to one shared view
When the supply chain is disconnected, decisions take longer and risks go up. It is similar to driving when you cannot see clearly.
When spreadsheets and applications are kept separate, information gaps appear. For example, a buyer might know about a delayed delivery, but the plant scheduler and warehouse may not find out in time, forcing last-minute changes to production.
A shared data view solves these problems by giving everyone the same information. When all teams use the same data, they can focus on solving issues instead of sorting out conflicting reports.
The data manufacturers need to see together
Good visibility brings together the most important operational signals.
Key data includes supplier performance, open purchase orders, promised versus actual delivery dates, and on-time, in-full results. Inventory should be tracked by site, item, lot, and usable status.
Additional critical data includes shipment milestones, carrier updates, warehouse receipts, production schedules, machine output, scrap, downtime, and demand signals.
A shared view is crucial because these data points depend on each other. For instance, a late-arriving part can shift production priorities, and a sudden jump in demand can quickly deplete inventory. Shipping updates only help if planners can see how they affect future schedules.
How disconnected data hurts manufacturing performance
When data is scattered, it affects more than just reports. It can hurt throughput, service levels, working capital, and how efficiently teams use their time.
With real-time visibility, teams can spot problems early, adjust plans quickly, cut down on waste, and keep up delivery performance. Without it, manufacturers waste time matching up data instead of acting.
Late supplier updates create hidden production risk
A delay from a supplier can quickly turn into bigger problems for production and customers.
If supplier updates come in late, planners might not find out about problems soon enough. Differences between systems can cause schedules to be made with missing materials, which leads to rescheduling, idle workers, line stoppages, or rushed substitutions.
Supplier visibility should connect directly to what production needs. A late shipment is not just a dashboard alert—it can mean missed builds, extra overtime costs, or lost revenue.
Poor inventory data leads to shortages or excess stock
When inventory data is wrong, it creates two problems: shortages that need urgent fixes and overbuying because teams do not trust the numbers.
When inventory data is out of date, planners often add extra safety stock and buffers, which ties up money and warehouse space. This can also hide problems such as counting errors, slow receipts, or incorrect item statuses.
On the other hand, if systems indicate parts are available but shelves are empty, production slows as teams search for materials, borrow from other lines, or rush new orders, thereby raising costs.
Slow logistics data makes it hard to react in time
Transit data is often ignored until a late delivery causes operational problems.
When logistics updates are delayed, manufacturers cannot respond as well. If a shipment delay is found within hours, it can be managed, but finding out the next day can mess up schedules and lead to missed or partial deliveries.
Shipping data needs to be part of operational systems so planning teams can quickly see how any significant inbound delays will affect them.
If procurement, warehouse, and plant teams all use different data, real visibility is lost, and conflicting information keeps showing up.
How Microsoft Fabric connects procurement, inventory, logistics, and production
Microsoft Fabric gives manufacturers one platform for data movement, storage, analytics, and reporting. Instead of building a patchwork of copies and refresh jobs, teams can work from shared data in OneLake.
That matters because supply chain data almost never starts in one place. It lives in ERP, MES, WMS, supplier feeds, transportation systems, spreadsheets, and third-party logistics tools.
Microsoft Fabric offers a single platform for moving, storing, analyzing, and reporting data. Teams can use shared data in OneLake, so there is no need for multiple copies or manual updates.
For manufacturers considering a migration to Microsoft Fabric, the process typically follows these main steps:
1. Assessment and Planning: Review current data sources, reporting requirements, and existing infrastructure. Define key objectives for the transition and identify initial high-impact use cases.
2. Data Integration: Connect core systems such as ERP, MES, WMS, spreadsheets, and supplier feeds to Fabric using Data Factory pipelines or Dataflows Gen2. Map and consolidate data into OneLake to ensure consistent and accessible datasets.
3. Model Development: Build semantic models and standardized data definitions tailored to supply chain needs, such as supplier OTIF or inventory days, to create a foundation for analytics and reporting.
4. Dashboard and Report Migration: Recreate or migrate existing dashboards and Power BI reports to leverage live, unified data from Fabric, ensuring teams see accurate and up-to-date insights.
5. Governance and Security Setup: Establish user access, roles, and sensitivity rules with integrated governance tools, such as Microsoft Purview, to protect critical information and streamline compliance.
6. Training and Adoption: Enable teams to use new dashboards and workflows, providing training and support for a smooth transition.
7. Continuous Improvement: Monitor usage and results, gathering feedback to refine data flows, definitions, and features over time.
Taking this step-by-step approach helps organizations manage risks, use resources wisely, and see value early during the migration.
This is important because supply chain data originates from various sources, including ERP, MES, WMS, supplier feeds, transportation systems, spreadsheets, and third-party logistics tools.
Unifying supplier, warehouse, and plant data with OneLake
OneLake serves as the shared data layer in Fabric, enabling teams to connect data without building new silos.
Shortcuts and mirroring help manufacturers more easily bring data from current systems into a single model.
Microsoft Fabric connects directly to common ERP, MES, and WMS platforms, ensuring it works with your existing setup. This reduces duplicate data, solves the “gold copy” problem, and gives you one trusted source for your data.
Supply chain teams can connect supplier POs, warehouse receipts, transport events, and production records all in one place. Using standard definitions in semantic models makes sure metrics like OTIF and inventory days are calculated the same way across departments.
Why Fabric works well for manufacturing teams
Fabric works well for manufacturing because it offers both speed and control. Data engineers can set up data flows with Data Factory pipelines and Dataflows Gen2, analysts can model data in Lakehouse or Warehouse, and business users can use Power BI. Governance is built in from the start.
Some Microsoft customers show how this works in practice.
Schaeffler used Fabric with an Azure AI factory operations agent, which helped workers quickly find the causes of downtime.
Iceland Foods brought all their data into OneLake and used Fabric Real-Time Intelligence with live Power BI reporting to cut down on data lag. In both cases, having connected data helped teams respond faster.
Spargent Analytics specializes in Microsoft Fabric consulting and delivery for US-based mid-market and enterprise teams. We design, implement, migrate, optimize, and support Fabric solutions across data ingestion, Data Factory pipelines, Dataflows Gen2, Lakehouse, Warehouse, OneLake, Power BI, semantic models, governance, real-time analytics, and managed support.
The EU-to-USA delivery model offers senior Fabric engineers, effective communication, an efficient cost structure, and improved ROI compared to many US-only consulting firms.
Post-implementation, the Spargent team provides extensive support to ensure long-term success, including tailored training for end users and technical teams, ongoing help desk support, and managed services to maintain your Fabric environment. Regular optimization reviews and knowledge transfer sessions help teams maximize adoption and value from your investment. If you are addressing fragmented reporting or planning a rollout Book a Microsoft Fabric Discovery Call.
From raw data to usable insights in Power BI
Connected data only matters if teams can access and use it easily.
Fabric makes this easier by letting Power BI work directly on the same data foundation, including Direct Lake setups that cut down on import delays. This means planners and plant leaders get up-to-date information without waiting for overnight updates or manual data merges.
Effective governance is essential. Supplier cost data, plant metrics, and customer order details require controlled access. Fabric, combined with Microsoft Purview, enables teams to manage data lineage, access rules, and sensitive information more effectively. Enterprise-grade security features such as role-based access control, encryption at rest and in transit, and advanced threat detection help ensure that sensitive supply chain information remains protected. Fabric also supports compliance with key regulatory frameworks and certifications, including GDPR and ISO/IEC 27001, providing executives with the confidence that both security and regulatory requirements are addressed. This leads to cleaner reporting, fewer manual workarounds, and a streamlined path to analytics without the need for a large internal data team.
The supply chain dashboard metrics that matter most
A good supply chain dashboard highlights the main questions that shape daily decisions.
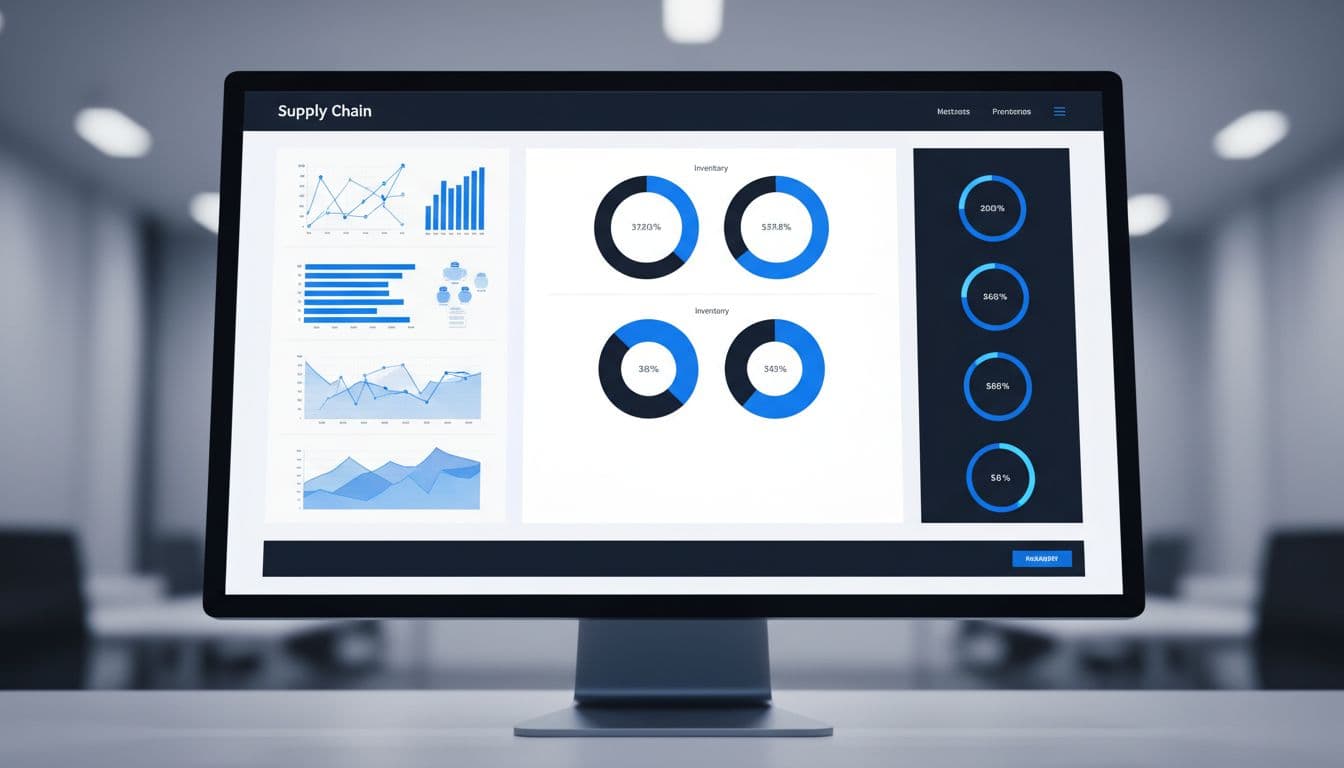
A well-designed dashboard shows clear inventory charts and performance metrics.
Usually, these four metrics appear first on the dashboard.
| Metric | What it answers | Why it matters |
|---|---|---|
| Supplier OTIF | Are suppliers arriving on time and in full? | Exposes reliability before it hits production |
| Inventory days | How long will the stock last? | Balances service, cash, and storage |
| Shortages | What will stop production soon? | Focuses teams on the next urgent gap |
| Lead-time risk | Which orders or suppliers are slipping? | Gives planners time to adjust |
When these metrics are current and accurate, teams can solve problems before they affect production.
Supplier OTIF tells you who is really keeping promises
OTIF, which stands for on-time, in-full, is one of the best ways to measure a supplier’s reliability.
A supplier might seem reliable overall, but still cause problems with important items. OTIF brings these issues to light. If a vendor is often late or sends only part of an order, procurement and planning teams need to know before they finish building plans. Over time, OTIF helps rank suppliers, improve vendor reviews, and spot ongoing weaknesses.
It is important to connect OTIF to real business impact. A low OTIF score matters most when it puts production, customer orders, or profits at risk.
Inventory days shows how long stock will last
Inventory days are simple to understand and helpful for all departments. It shows how long the current stock will last based on expected usage.
This makes inventory days a better measure than just looking at on-hand balances. A high unit count might not be enough if demand is rising, while a lower count could be fine if demand is steady and supply is reliable.
For manufacturers, inventory days help balance the risks of running out of stock and having too much. It can reduce overbuying, support better restocking, and show where working capital is not being used effectively.
Shortages and lead-time risk help teams act early
Shortage alerts and lead-time risk signals push teams to act right away.
A shortage view should focus on parts that could stop scheduled production, not just list every low-stock item. Lead-time risk should consider current PO aging, delivery delays, transit problems, and changes in supplier performance—not just standard lead times.
When these signals are combined, teams can act sooner by speeding up shipments, changing production order, moving inventory, or working with other suppliers. The real value of visibility is acting early, not predicting everything perfectly.
If your team uses Power BI reports but does not have a unified Fabric foundation, it may be time to Plan Your Power BI to Fabric Migration.
Better visibility protects production
Disconnected data causes ongoing inefficiencies in manufacturing. Even a single late shipment or an incorrect inventory count can turn small issues into major production problems. A Fabric-based supply chain view provides everyone with shared, trusted data across procurement, inventory, logistics, and production. This helps teams avoid shortages, keep schedules on track, and make smart decisions before production is at risk.
If the current process still depends on Excel reconciliations, manual refreshes, or competing dashboards, the next step is clear. Request a Fabric Readiness Assessment and build a supply chain dashboard your team can trust.
